. 2008 Apr;10(4):452-9.
doi: 10.1038/ncb1708. Epub 2008 Mar 2.

Lamin A-dependent misregulation of adult stem cells associated with accelerated ageing

Affiliations

Lamin A-dependent misregulation of adult stem cells associated with accelerated ageing

Paola Scaffidi et al. Nat Cell Biol. 2008 Apr.

Abstract

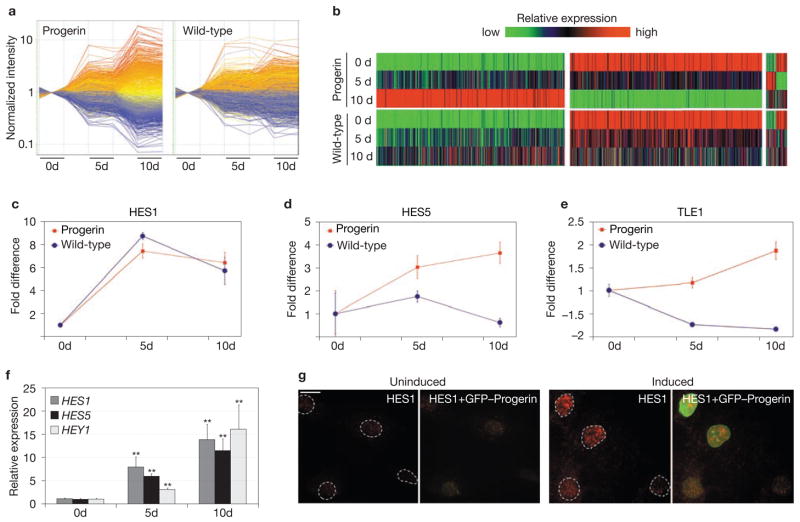
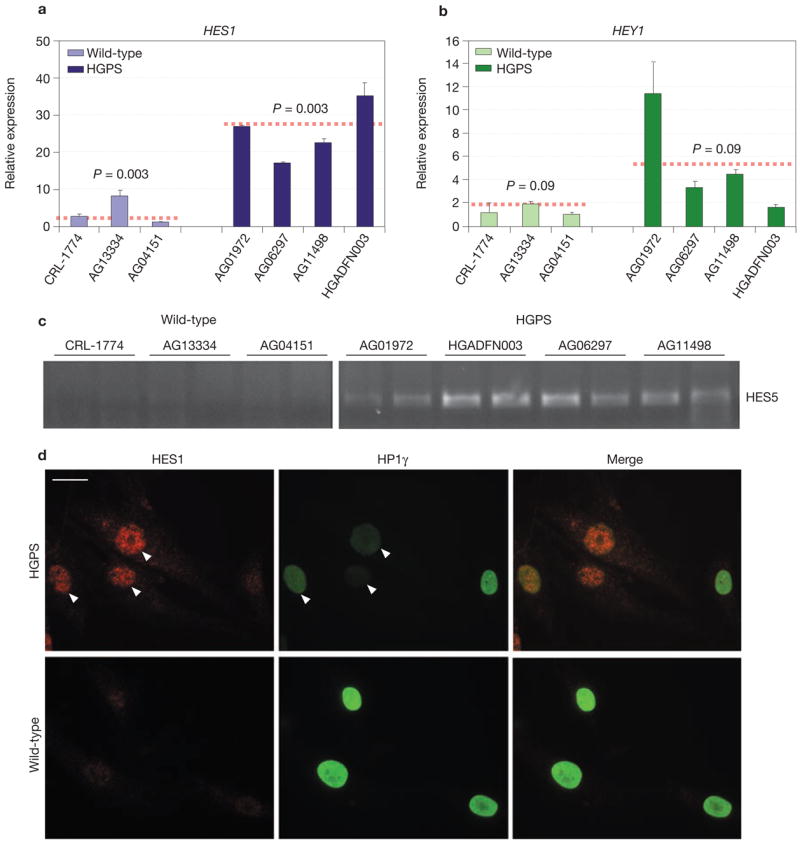
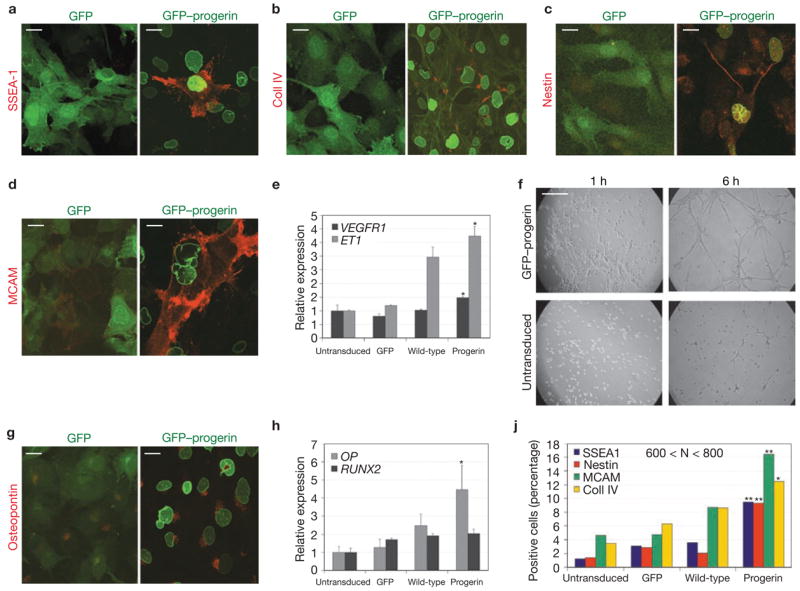
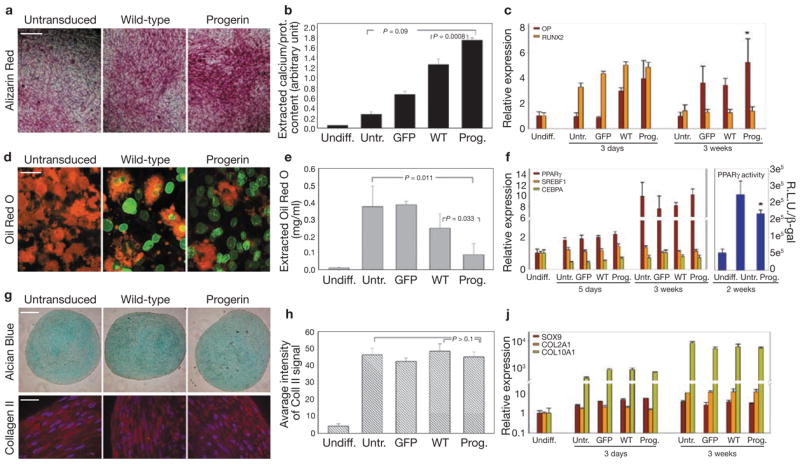
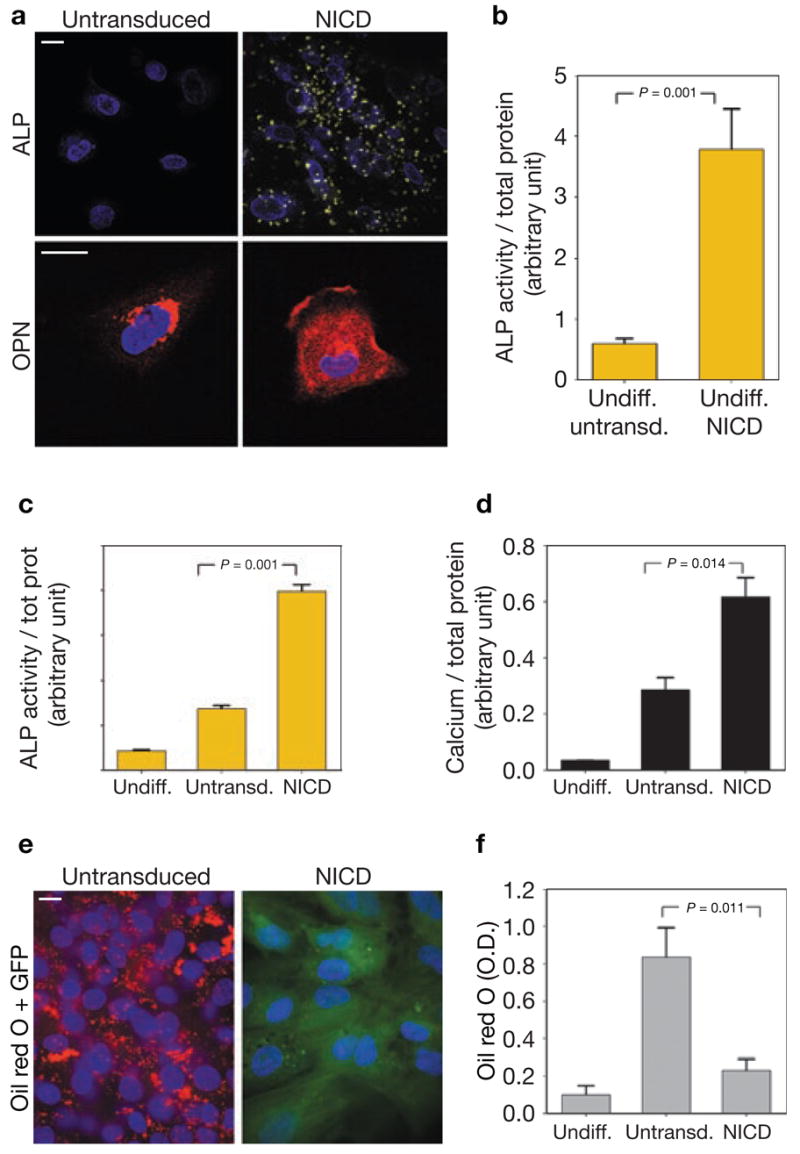
The premature-ageing disease Hutchinson-Gilford Progeria Syndrome (HGPS) is caused by constitutive production of progerin, a mutant form of the nuclear architectural protein lamin A. Progerin is also expressed sporadically in wild-type cells and has been linked to physiological ageing. Cells from HGPS patients exhibit extensive nuclear defects, including abnormal chromatin structure and increased DNA damage. At the organismal level, HGPS affects several tissues, particularly those of mesenchymal origin. How the cellular defects of HGPS cells lead to the organismal defects has been unclear. Here, we provide evidence that progerin interferes with the function of human mesenchymal stem cells (hMSCs). We find that expression of progerin activates major downstream effectors of the Notch signalling pathway. Induction of progerin in hMSCs changes their molecular identity and differentiation potential. Our results support a model in which accelerated ageing in HGPS patients, and possibly also physiological ageing, is the result of adult stem cell dysfunction and progressive deterioration of tissue functions.


Figures

Figure 1
Figure 1
Activation of Notch signalling pathway effectors in response to progerin. (a) Time-dependent changes in gene expression in skin fibroblasts expressing progerin and wild-type lamin A. Normalized intensity of differentially expressed genes (≥ 2-fold) in either cell line (1394 genes) is plotted as a function of time relative to each uninduced state. Values of the two replicates are shown for each sample. The colour of each gene corresponds to its colour in progerin-expressing cells at 10 d. Red–orange are upregulated genes, blue–grey are downregulated genes. (b) Heatmap representing relative expression levels of genes showing a difference of at least 2-fold on induction in either cell line. Colours represent values normalized to the range of intensity for each gene in all conditions. Genes progressively upregulated, progressively downregulated or transiently up- or downregulated in progerin-expressing cells and the corresponding changes in wild-type lamin A-expressing cells are shown. (c–e) Time-dependent changes in expression levels of HES1 (c), HES5 (d) and TLE1 (e) in cells expressing either progerin or wild-type lamin A, as detected by microarrays. Values represent mean ± s. d. from two biological replicates. (f) Time-dependent changes in expression levels of HES1, HES5 and HEY1 during induction in progerin-expressing cells detected by quantitative RT-PCR. Values are normalized to the housekeeping gene cyclophillin A. Asterisks indicate statistically significant differences compared with the uninduced state (P < 0.001). Values represent mean ± s. d. from two biological replicates. (g) Immunofluorescence microscopy of progerin-expressing cells before induction and 4 d after doxycycline removal using an anti-HES1 antibody. The presence of HES1 correlates with expression of GFP–progerin. Scale bar: 20 μm.
Figure 2
Figure 2
Activation of Notch signalling pathway effectors in cells from HGPS patients. (a, b) Quantitative RT-PCR analysis of HES1 and HEY1 expression levels in four different HGPS cells lines and three wild-type control cell lines. Values are normalized to the housekeeping gene cyclophillin A. Statistical significance of the differences between the two groups of cell lines is shown. Values represent mean ± s. d from at least two experiments. (c) Semi-quantitative RT-PCR analysis of HES5 expression levels in four different HGPS cells lines and three wild-type control cell lines. Each sample was analysed in duplicate and products were detected with Syber Green. (d) Immunofluorescence microscopy of HGPS cells using anti-HES1 and anti-HP1γ antibodies. The presence of HES1 correlates with progerin-induced reduction of HP1γ (arrows). Scale bar: 15 μm.
Figure 3
Figure 3
Progerin alters the molecular and cellular identity of hMSCs. (a–d, g) Immunofluorescence microscopy of undifferentiated hMSCs expressing GFP or GFP–progerin using the indicated antibodies. Merge between the GFP signal (green) and the antibody signal (red) is shown. FITC–phalloidin was used together with anti-collagen IV to show the cellular edge. Scale bar: 20 μm. (e, h) Quantitative RT-PCR analysis of expression levels of endothelial (e) and osteogenic (h) markers in untransduced hMSCs and cells expressing GFP, GFP–progerin, or GFP–wt-lamin A. Statistical significance of the differences between progerin-expressing and untransduced cells is indicated by one asterisk (P < 0.05). Values represent mean ± s. d from two experiments. (f) Angiogenic assay. Undifferentiated hMSCs expressing GFP–progerin or untransduced were plated onto basement membrane extract in the presence of 10 ng ml−1 h VEGF. Pictures were taken at the indicated times after plating. Scale bar: 1 mm. (j). Quantification of differentiation markers in undifferentiated hMSCs expressing GFP, GFP–progerin or GFP–wt-lamin A, or untransduced. Statistical significance of the differences between progerin- and wild-type lamin A-expressing cells is indicated by one (P < 0.05) or two (P < 0.0005) asterisks. 600 < N < 800 cells.
Figure 4
Figure 4
Altered differentiation potential of progerin-expressing hMSCs. (a) Detection of mineralized matrix by Alizarin red staining in hMSCs expressing GFP–progerin or GFP–wt-lamin A or untransduced after 18 d of osteogenic differentiation. Scale bar: 150 μm. (b) Quantitative analysis of calcium deposition by hMSCs expressing GFP, GFP–progerin or GFP–wt-lamin A or untransduced after 18 d of osteogenic differentiation. Values represent mean ± s. d. from three biological replicates. Statistical significance of the differences between progerin-expressing cells and untransduced or wild-type lamin A-expressing cells is indicated. (c, f, j) Quantitative RT-PCR analysis of expression levels of osteogenic (c), adipogenic (f, left panel) and chondrogenic (j) markers in hMSCs expressing GFP, GFP–progerin, or GFP–wt-lamin A or untransduced after 3–5 d and 21 d of differentiation. Values represent mean ± s. d. from three biological replicates. The right panel in f shows luciferase assays measuring PPARγ activity. Values represents mean ± s. d. from three biological replicates. Statistical significance of the differences between progerin-expressing cells and untransduced cells is indicated by the asterisk (P < 0.05). (d) Detection of lipid droplets by Oil red O staining in hMSCs expressing GFP–progerin or GFP–wt-lamin A or untransduced after 19 d of adipogenic differentiation. Merge between the GFP signal (green) and the Oil red O signal (red) is shown. Oil red O was observed using a Texas Red filter. Scale bar: 40 μm. (e) Quantitative analysis of incorporated Oil red O after elution with isopropanol. Values represent mean ± s. d. from three biological replicates. Statistical significance of the differences between progerin-expressing cells and untransduced or wild-type lamin A-expressing cells is indicated. (g) Detection of glycosaminoglycans in cartilage pellets by Alcian Blue staining, and collagen II by indirect immunofluorescence microscopy. Merge between collagen II staining (red) and DAPI staining (blue) is shown. Scale bar: 500 μm. (h) Quantitative analysis of collagen II fluorescent signal in cartilage pellets derived from hMSCs expressing GFP, GFP–progerin or GFP–wt-lamin A or untransduced after 23 d of chondrogenesis. Values represent mean ± s. d. from three different sections. Statistical significance of the differences between progerin- expressing cells and untransduced or wild-type lamin A-expressing cells is indicated. Scale bar: 40 μm.
Figure 5
Figure 5
Altered differentiation potential of NICD-expressing hMSCs. (a) Immunofluorescence microscopy of undifferentiated hMSCs untransduced or expressing NICD using a fluorescent substrate of alkaline phosphatase (ALP) and an anti-osteopontin (OPN) antibody. The presence of yellow crystals indicates enzyme activity in NICD-expressing hMSCs. No crystals were detected in untransduced hMSCs. High levels of extracellular osteopontin were detected in undifferentiated NICD-expressing cells but not in untransduced cells. Merge with the DAPI signal (blue) is shown. Scale bar: 10 μm. (b, c) Quantification of alkaline phosphatase activity by spectrophotometric analysis in undifferentiated hMSCs (b) and differentiated osteoblasts (c). Values represent mean ± s. d. from three biological replicates. Statistical significance of the differences is indicated. (d) Quantitative analysis of calcium deposition by hMSCs expressing NICD or untransduced cells after 20 d of osteogenic differentiation. Values represent mean ± s. d. from three biological replicates. The statistical significance of the differences is indicated. (e) Observation of lipid droplets by Oil red O staining in hMSCs expressing NICD or untransduced cells after 21 d of adipogenic differentiation. Merge between the DAPI signal (blue), the GFP signal (green) and the Oil red O signal (red) is shown. Oil red O was shown using a Texas Red filter. Scale bar: 10 μm. (f) Quantitative analysis of incorporated Oil red O after elution with isopropanol. Values represent mean ± s. d. from three biological replicates. Statistical significance of the differences is indicated.

References

    1. Eriksson M, et al. Recurrent de novo point mutations in lamin A cause Hutchinson-Gilford progeria syndrome. Nature. 2003;423:293–298. - PMC - PubMed
    1. De Sandre-Giovannoli A, et al. Lamin A truncation in Hutchinson-Gilford progeria. Science. 2003;300:2055. - PubMed
    1. Scaffidi P, Misteli T. Lamin A-dependent nuclear defects in human ageing. Science. 2006;312:1059–1063. - PMC - PubMed
    1. Scaffidi P, Misteli T. Reversal of the cellular phenotype in the premature ageing disease Hutchinson-Gilford progeria syndrome. Nature Med. 2005;11:440–445. - PMC - PubMed
    1. Shumaker DK, et al. Mutant nuclear lamin A leads to progressive alterations of epigenetic control in premature ageing. Proc Natl Acad Sci USA. 2006;103:8703–8708. - PMC - PubMed

Publication types

MeSH terms