. 2008 Apr;40(4):476-83.
doi: 10.1038/ng.101. Epub 2008 Mar 2.

Exploiting position effects and the gypsy retrovirus insulator to engineer precisely expressed transgenes

Affiliations

Exploiting position effects and the gypsy retrovirus insulator to engineer precisely expressed transgenes

Michele Markstein et al. Nat Genet. 2008 Apr.

Abstract

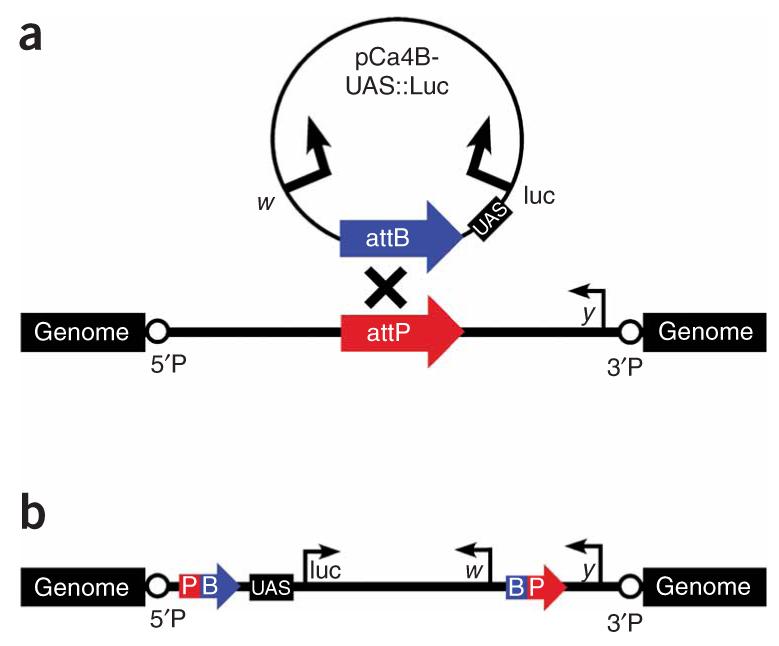
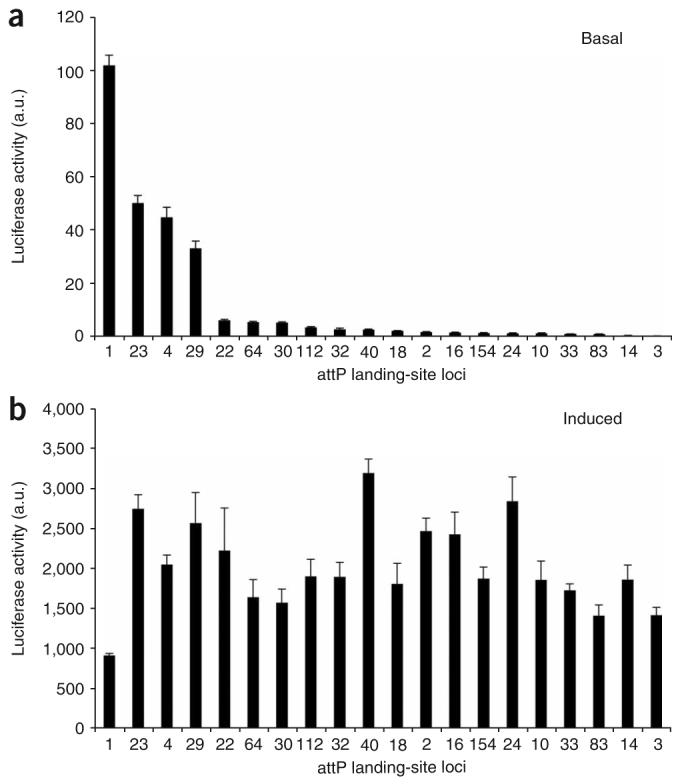
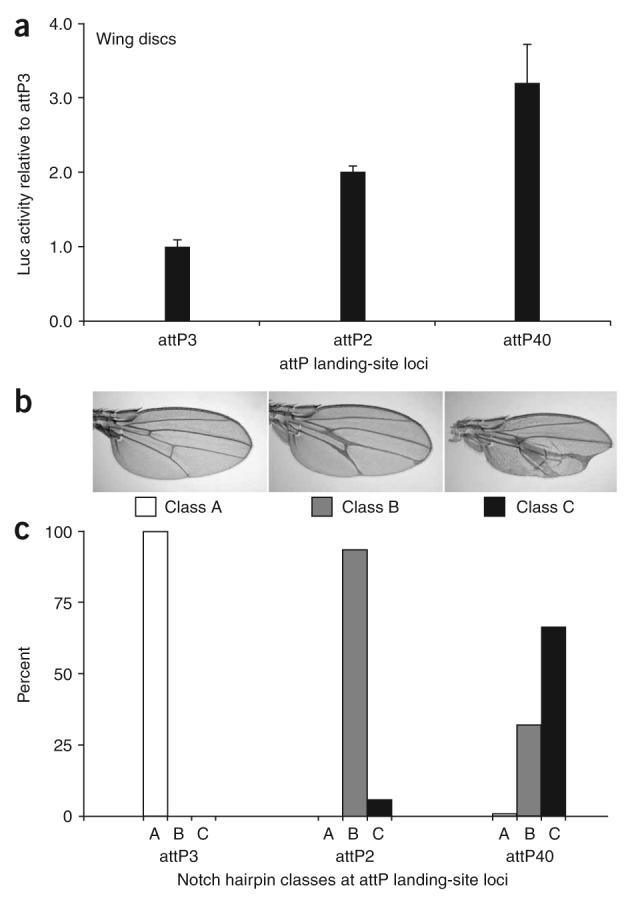
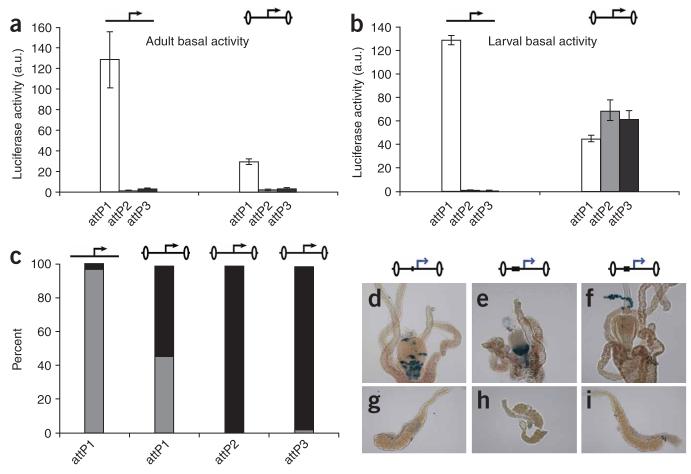
A major obstacle to creating precisely expressed transgenes lies in the epigenetic effects of the host chromatin that surrounds them. Here we present a strategy to overcome this problem, employing a Gal4-inducible luciferase assay to systematically quantify position effects of host chromatin and the ability of insulators to counteract these effects at phiC31 integration loci randomly distributed throughout the Drosophila genome. We identify loci that can be exploited to deliver precise doses of transgene expression to specific tissues. Moreover, we uncover a previously unrecognized property of the gypsy retrovirus insulator to boost gene expression to levels severalfold greater than at most or possibly all un-insulated loci, in every tissue tested. These findings provide the first opportunity to create a battery of transgenes that can be reliably expressed at high levels in virtually any tissue by integration at a single locus, and conversely, to engineer a controlled phenotypic allelic series by exploiting several loci. The generality of our approach makes it adaptable to other model systems to identify and modify loci for optimal transgene expression.


Figures

Figure 1
Figure 1
The UAS::luciferase reporter before and after integration at attP docking sites. (a) A schematic of the UAS::luciferase reporter plasmid and an attP docking site before integration showing the relative orientations of the marker genes w and y and the 5′P and 3′P P-element ends flanking the attP landing site. (b) Site-specific integration between the attB and attP sequences results in hybrid attP-attB sites encompassing the entire integrated pCa4B-UAS::luc plasmid, with the 5′ regulatory region of the UAS::luciferase reporter positioned close to flanking genomic DNA.
Figure 2
Figure 2
Levels of basal and inducible expression at attP landing sites are uncorrelated. Levels of luciferase activity were measured from five pools of three L3 female larvae each, with up to one outlier removed per genotype. Luciferase activity was normalized to total protein. Each bar represents the mean, and the error bars represent the s.d. (a) Basal activity was measured from heterozygous UAS::luciferase transgenic animals in the absence of a Gal4 driver. (b) Induced activity was measured from compound heterozygotes carrying one copy of the UAS::luciferase transgene and one copy of the ubiquitously expressed Act5C::Gal4 driver. The same trends were observed in biological replicates using both single L3 larvae and pools of larvae. Luciferase values normalized to total protein are shown as arbitrary units (a.u.).
Figure 3
Figure 3
Position effects are tissue dependent. Luciferase activity was measured from five pools of compound heterozygous female larvae, as in Figure 2, in three tissues: (a) in muscle using the dMEF2::Gal4 driver, (b) in fat body using the Cg::Gal4 driver and (c) in the nervous system using the Nrv2::Gal4 driver. Patterns of Gal4 expression in muscle, fat body and the nervous system were visualized in L3 larvae carrying the respective Gal4 driver and UAS::eGFP, shown to the left of each graph. Each bar represents the fold of luciferase activity induced at the specified attP landing site relative to luciferase activity induced from the attP3 site. The same trends were observed in biological replicates.
Figure 4
Figure 4
Exploiting position effects to create an allelic series. (a) Luciferase activity was measured from six pools of three wing discs each, isolated from compound heterozygous females containing one copy of UAS::luciferase and one copy of the en::Gal4 driver. (b) Three classes of wing phenotypes were observed and imaged in compound heterozygous animals containing the en::Gal4 driver and the UAS::Notch RNAi hairpin. Class A appears wild type, class B shows moderately thickened veins that sometimes form deltas close to the wing margin, and class C shows severely thickened veins coupled with notches of the wing margin. (c) The proportion of wing phenotypes in each class is shown for compound heterozygotes containing one copy of en::Gal4 and one copy of UAS::NotchRNAi at the respective landing site shown. Over 200 adults were scored for each genotype.
Figure 5
Figure 5
The gypsy insulator increases Gal4-inducible gene expression in larval and adult tissues. (a) Uninsulated (left) and insulated (right) UAS::luciferase transgene expression was induced in larval muscle with the dMEF2::Gal4 driver and measured as in Figure 2. The transgenes are diagrammed with UAS::luciferase represented by an arrow, the gypsy insulator represented by flanking ovals and the Gal4 driver indicated as a gray circle. (b) Uninsulated luciferase expression was induced in larval muscle with the same driver as in a and measured across 20 attP loci. For each locus, six individual L3 females were measured, with up to one outlier removed per genotype. Dark gray bars represent the fold of luciferase activity induced at the specified attP landing site relative to luciferase activity induced from attP3. Error bars, s.d. The three bars on the right represent projections of relative luciferase activity from gypsy-insulated transgenes at attP1 (white), attP2 (light gray) and attP3 (black) based on the relative increases at each locus as observed in a. (c) Uninsulated (left) and insulated (right) UAS::luciferase transgene expression was induced in larval fat body with the Cg::Gal4 driver, the larval imaginal discs with the ap::Gal4 driver, and ubiquitously in larvae with the da::Gal4 driver and measured as in Figure 2. (d,e) Uninsulated (left) and insulated (right) UAS::luciferase transgene expression was induced in adult muscle with dMEF2::Gal4 (d) and in adult fat body with CG::Gal4 (e) and measured in pools of three adult females as in Figure 2.
Figure 6
Figure 6
The gypsy insulator increases expression of an endogenous salivary gland enhancer in the HSP70 promoter. (a,b) Basal activity was measured as in Figure 2 in adults (a) and larvae (b) containing either the uninsulated (left) or insulated (right) UAS::luciferase transgene in the absence of a Gal4 driver. (c) Luciferase activity was measured in dissected individual L3 females homozygous for either the uninsulated UAS::luciferase or gypsy-insulated UAS::luciferase, as diagrammed by the above cartoons in which the insulator is depicted with flanking ovals. Each bar represents the average measurements from three to eight individual dissected larvae, showing the proportion of luciferase activity from the salivary gland (black bars) relative to the activity from the remainder of the body (gray bars). (d-i) Ectopic salivary gland activity is not detected in gypsy-flanked constructs driven by the eve promoter. Three constructs were tested as depicted by the above cartoons, showing the eve promoter as a blue arrow, the intervening cis-regulatory DNA as a black box and the gypsy insulator as flanking ovals. Xgal staining shows that each cis-regulatory DNA directed expression in a unique pattern in the larval foregut (top panels), which serves as a positive control for the staining, but none of the constructs showed activity in the salivary glands (lower panels). The enhancers in the constructs were the 214-bp Ady enhancer (d,g), the 498-bp brk enhancer (e,h), and the 350-bp vnd enhancer (f,i)—each linked to the eve promoter and flanked by gypsy insulators.

Comment in

  • Delivery codes for fly transgenics.
    Tubon TC Jr, Yin JC. Tubon TC Jr, et al. Nat Genet. 2008 Apr;40(4):383-4. doi: 10.1038/ng0408-383. Nat Genet. 2008. PMID: 18368126 No abstract available.

References

    1. Anderson KV, Ingham PW. The transformation of the model organism: a decade of developmental genetics. Nat. Genet. 2003;33(Suppl.):285–293. - PubMed
    1. Stathopoulos A, Levine M. Genomic regulatory networks and animal development. Dev. Cell. 2005;9:449–462. - PubMed
    1. Lewis EB. The phenomenon of position effect. Adv. Genet. 1950;3:73–115. - PubMed
    1. Spradling AC, Rubin GM. The effect of chromosomal position on the expression of the Drosophila xanthine dehydrogenase gene. Cell. 1983;34:47–57. - PubMed
    1. Levis R, Hazelrigg T, Rubin GM. Effects of genomic position on the expression of transduced copies of the white gene of Drosophila. Science. 1985;229:558–561. - PubMed

Publication types

MeSH terms

LinkOut - more resources