

Diverse metabolic model parameters generate similar methionine cycle dynamics
- PMID: 18313076
- PMCID: PMC2386584
- DOI: 10.1016/j.jtbi.2007.12.009
Diverse metabolic model parameters generate similar methionine cycle dynamics
Abstract
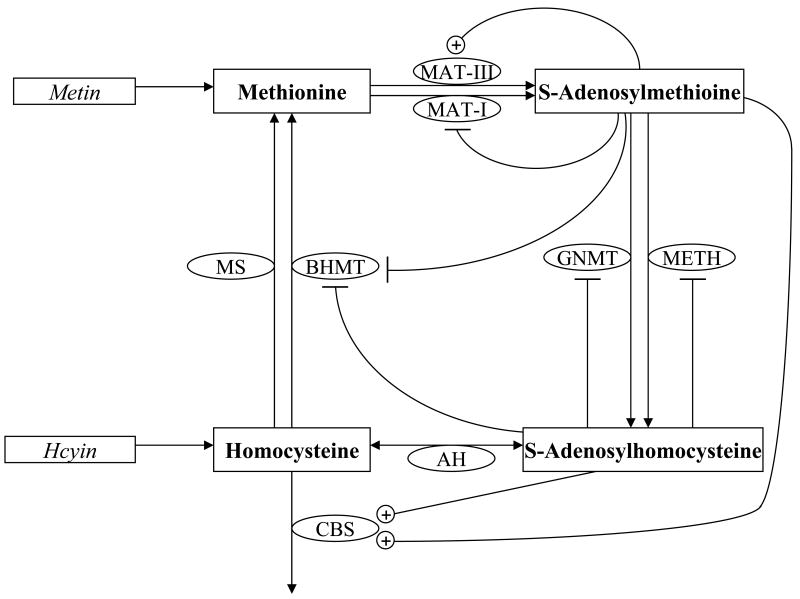
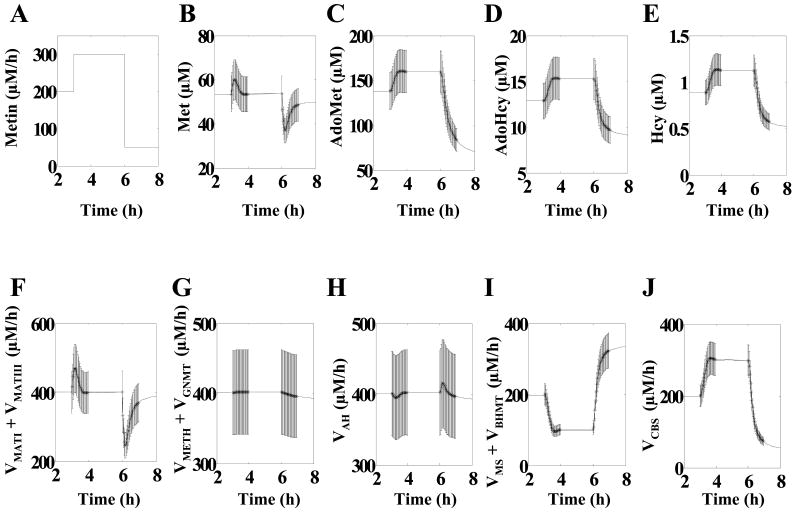
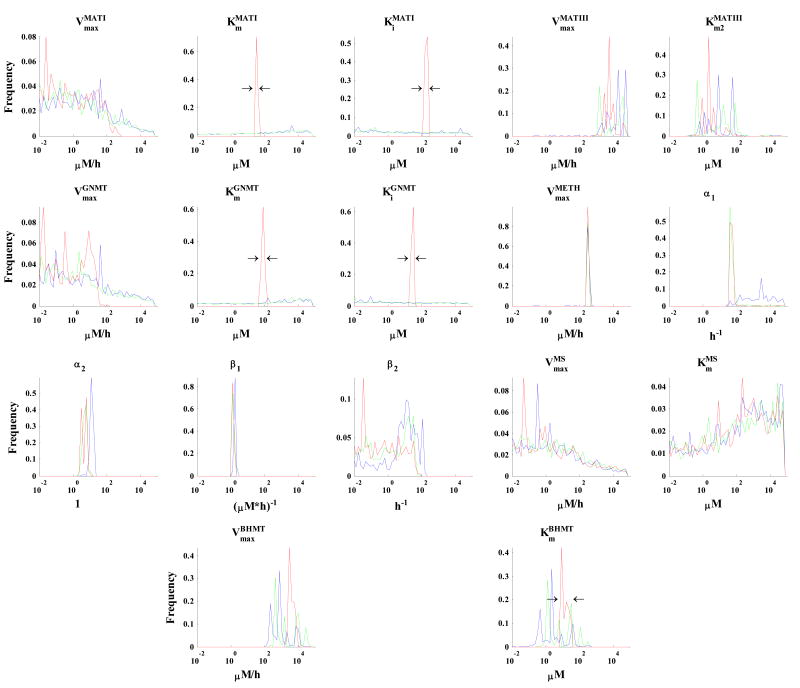
Parameter estimation constitutes a major challenge in dynamic modeling of metabolic networks. Here we examine, via computational simulations, the influence of system nonlinearity and the nature of available data on the distribution and predictive capability of identified model parameters. Simulated methionine cycle metabolite concentration data (both with and without corresponding flux data) was inverted to identify model parameters consistent with it. Thousands of diverse parameter families were found to be consistent with the data to within moderate error, with most of the parameter values spanning over 1000-fold ranges irrespective of whether flux data was included. Due to strong correlations within the extracted parameter families, model predictions were generally reliable despite the broad ranges found for individual parameters. Inclusion of flux data, by strengthening these correlations, resulted in substantially more reliable flux predictions. These findings suggest that, despite the difficulty of extracting biochemically accurate model parameters from system level data, such data may nevertheless prove adequate for driving the development of predictive dynamic metabolic models.
Figures


Similar articles
-
Bringing metabolic networks to life: integration of kinetic, metabolic, and proteomic data.Theor Biol Med Model. 2006 Dec 15;3:42. doi: 10.1186/1742-4682-3-42. Theor Biol Med Model. 2006. PMID: 17173670 Free PMC article.
-
Including metabolite concentrations into flux balance analysis: thermodynamic realizability as a constraint on flux distributions in metabolic networks.BMC Syst Biol. 2007 Jun 1;1:23. doi: 10.1186/1752-0509-1-23. BMC Syst Biol. 2007. PMID: 17543097 Free PMC article.
-
Estimation of flux ratios without uptake or release data: Application to serine and methionine metabolism.Metab Eng. 2017 Sep;43(Pt B):137-146. doi: 10.1016/j.ymben.2017.02.005. Epub 2017 Feb 20. Metab Eng. 2017. PMID: 28232235 Free PMC article.
-
Metabolic ensemble modeling for strain engineers.Biotechnol J. 2012 Mar;7(3):343-53. doi: 10.1002/biot.201100186. Epub 2011 Oct 21. Biotechnol J. 2012. PMID: 22021171 Review.
-
The logic of the hepatic methionine metabolic cycle.Biochim Biophys Acta. 2010 Jan;1804(1):89-96. doi: 10.1016/j.bbapap.2009.10.004. Epub 2009 Oct 13. Biochim Biophys Acta. 2010. PMID: 19833238 Free PMC article. Review.
Cited by
-
An iterative identification procedure for dynamic modeling of biochemical networks.BMC Syst Biol. 2010 Feb 17;4:11. doi: 10.1186/1752-0509-4-11. BMC Syst Biol. 2010. PMID: 20163703 Free PMC article.
-
Metabolomics-driven quantitative analysis of ammonia assimilation in E. coli.Mol Syst Biol. 2009;5:302. doi: 10.1038/msb.2009.60. Epub 2009 Aug 18. Mol Syst Biol. 2009. PMID: 19690571 Free PMC article.
-
A Bayesian active learning strategy for sequential experimental design in systems biology.BMC Syst Biol. 2014 Sep 26;8(1):102. doi: 10.1186/s12918-014-0102-6. Online ahead of print. BMC Syst Biol. 2014. PMID: 25256134 Free PMC article.
-
Identification of neutral biochemical network models from time series data.BMC Syst Biol. 2009 May 5;3:47. doi: 10.1186/1752-0509-3-47. BMC Syst Biol. 2009. PMID: 19416537 Free PMC article.
-
System drift and speciation.Evolution. 2022 Feb;76(2):236-251. doi: 10.1111/evo.14356. Epub 2021 Oct 7. Evolution. 2022. PMID: 34529267 Free PMC article.
References
-
- Avila MA, Garcia-Trevijano ER, Martinez-Chantar ML, Latasa MU, Perez-Mato I, Martinez-Cruz LA, del Pino MMS, Corrales FJ, Mato JM. S-Adenosylmethionine revisited: its essential role in the regulation of liver function. Alcohol. 2002;27:163–167. - PubMed
-
- Barkai N, Leibler S. Robustness in simple biochemical networks. Nature. 1997;387:913–917. - PubMed
Publication types
MeSH terms
Substances
Grants and funding
LinkOut - more resources
Full Text Sources
