. 2008 Aug;24(8):1107-13.
doi: 10.1016/j.dental.2008.01.002. Epub 2008 Mar 7.

Fractographic failure analysis of a Procera AllCeram crown using stereo and scanning electron microscopy

Affiliations

Fractographic failure analysis of a Procera AllCeram crown using stereo and scanning electron microscopy

Susanne S Scherrer et al. Dent Mater. 2008 Aug.

Abstract

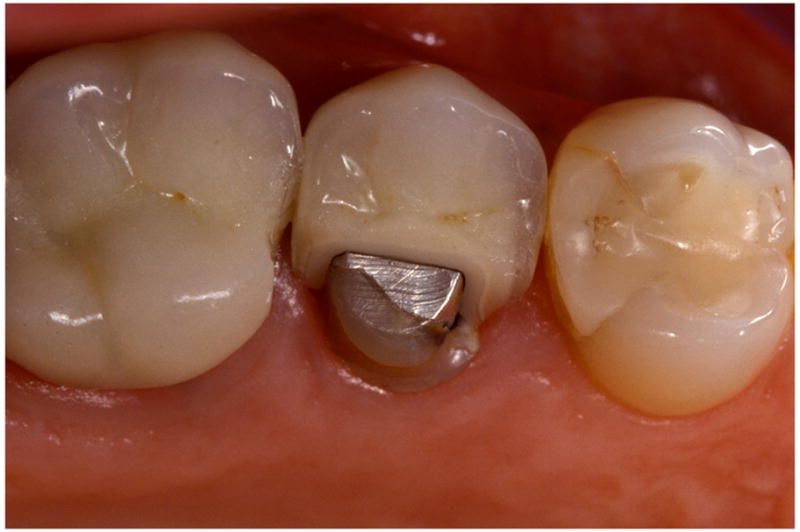
Objectives: Presentation of a methodological approach using stereo and scanning electron microscope examination for the failure analysis of an alumina all-ceramic premolar crown (Procera AllCeram).

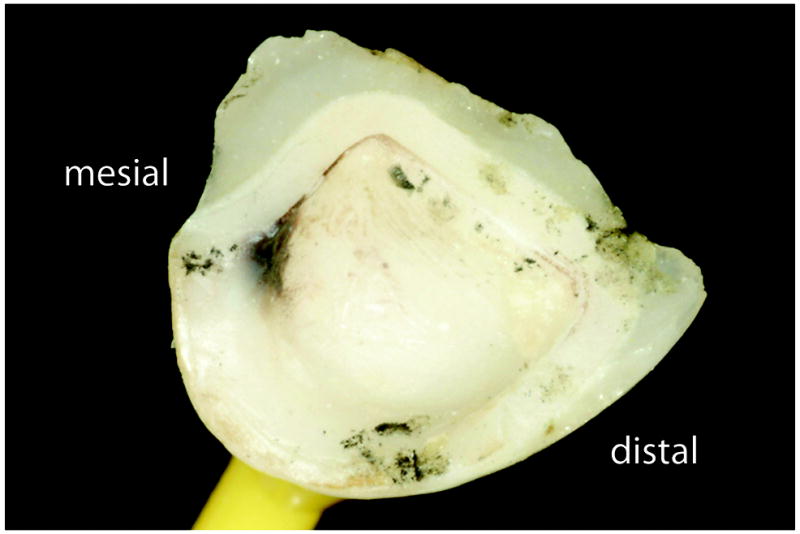
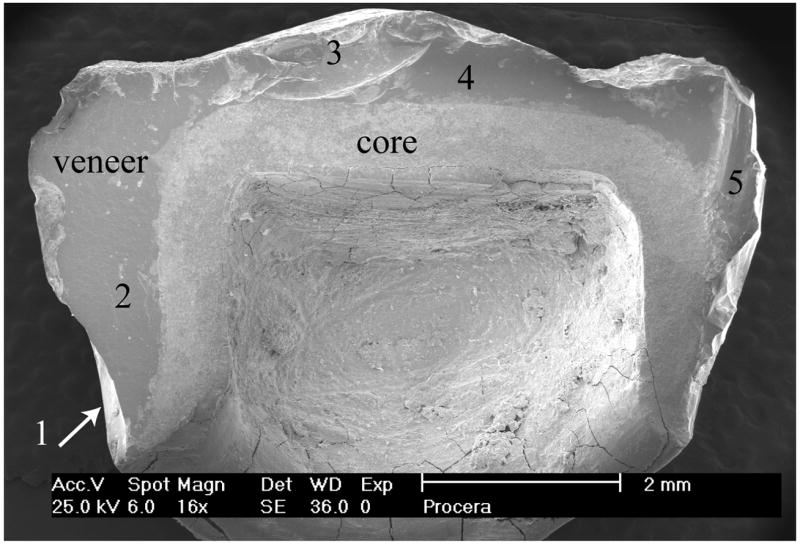
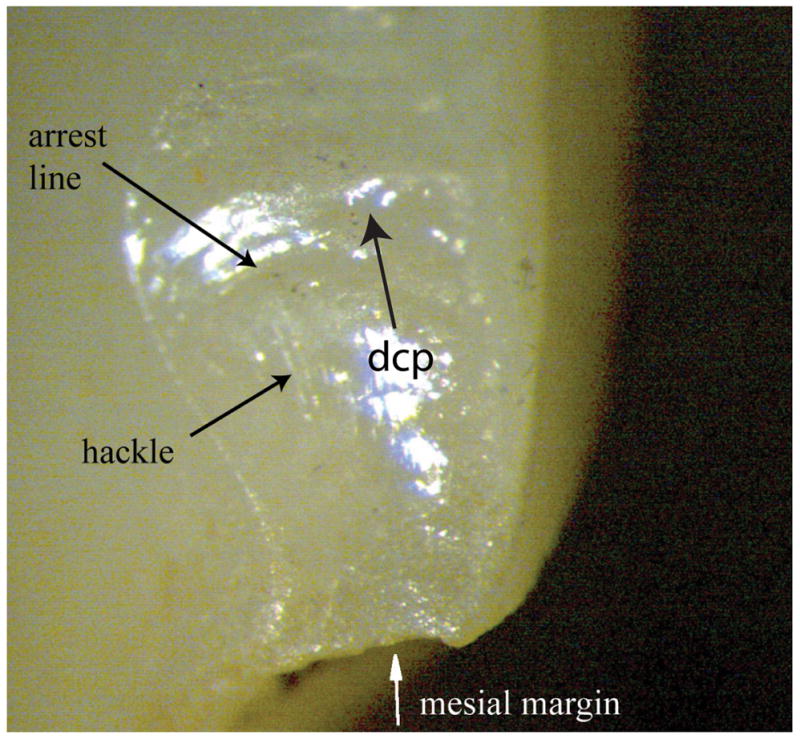
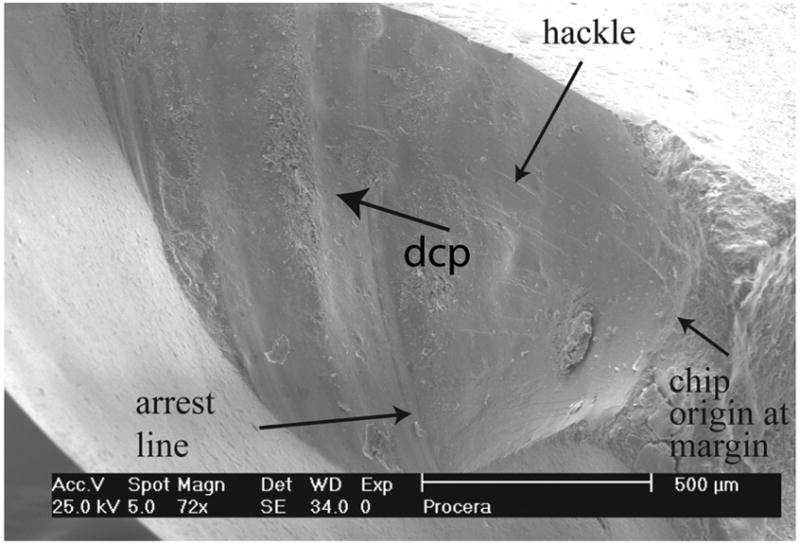
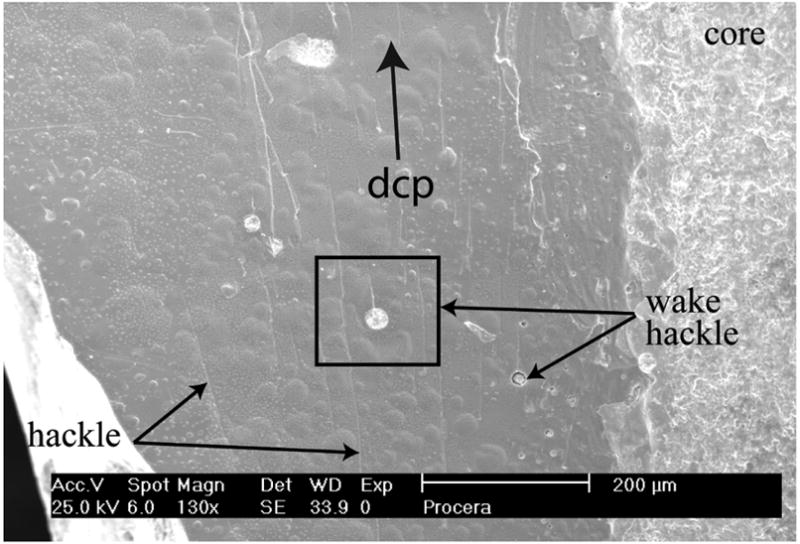
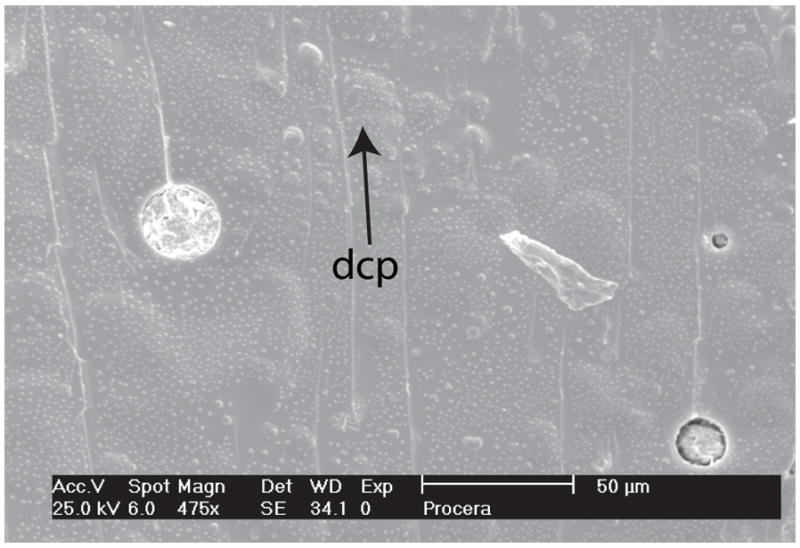
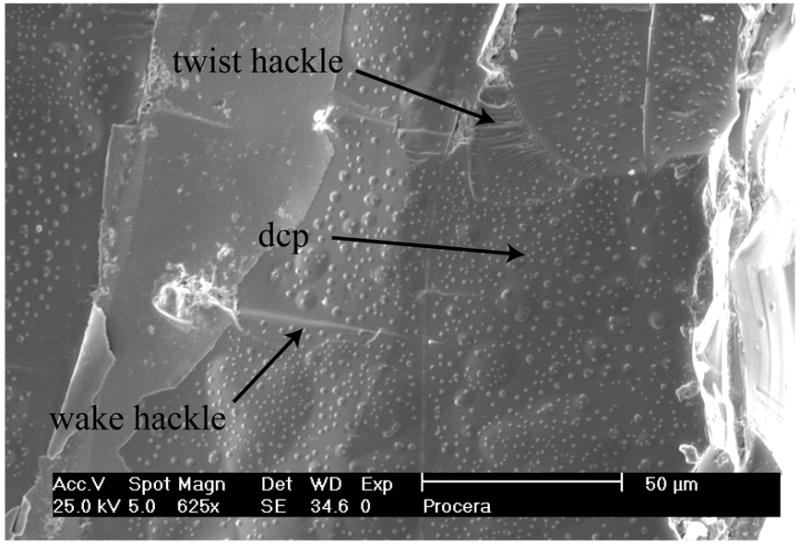
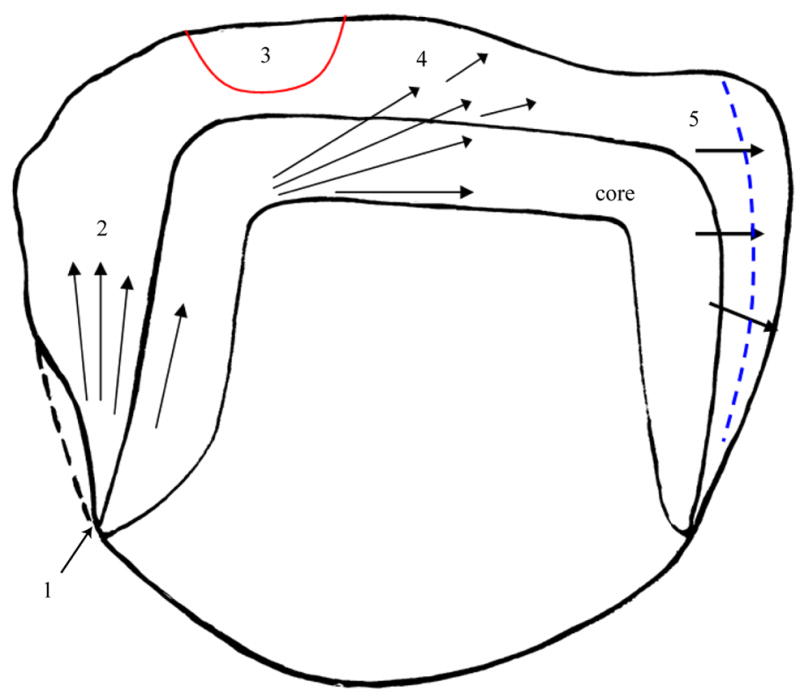
Methods: The recovered part of a fractured Procera alumina crown was examined utilizing first a stereomicroscope and second a scanning electron microscope (SEM). The stereomicroscope analysis was performed at low magnifications with oblique lighting in order to enhance spatial relationships and gross detection of crack features. A preliminary fracture surface map of the stereo observations was drawn and used as a guide for the SEM analysis that followed. Specific sites of interest identified under the stereo microscope were analyzed using the SEM at high magnifications searching for small fracture features such as wake hackle and twist hackle within the veneering ceramic in order to confirm the direction of crack propagation.

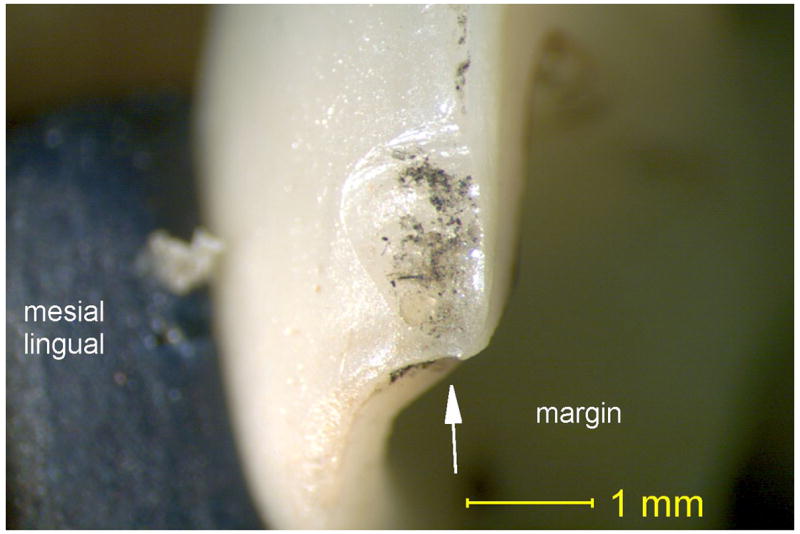
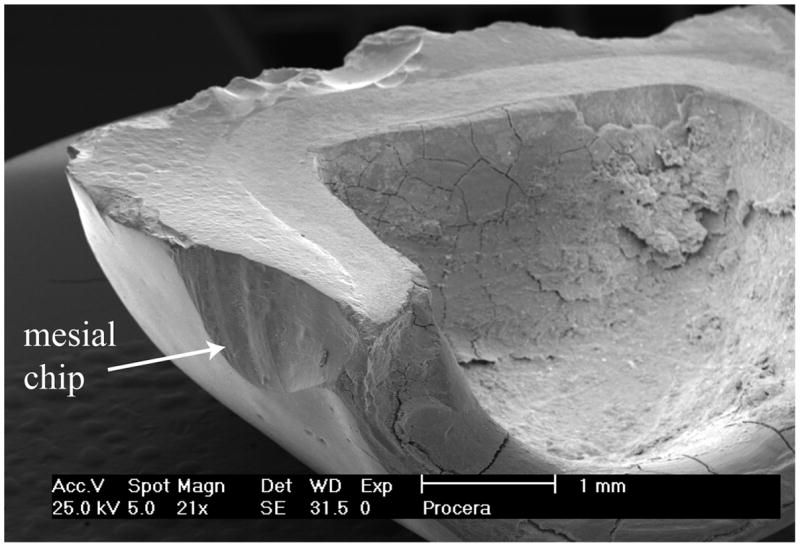
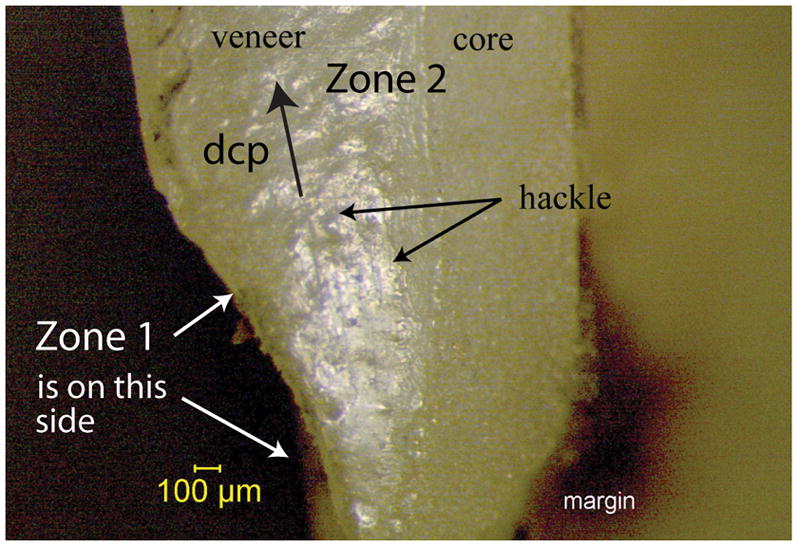
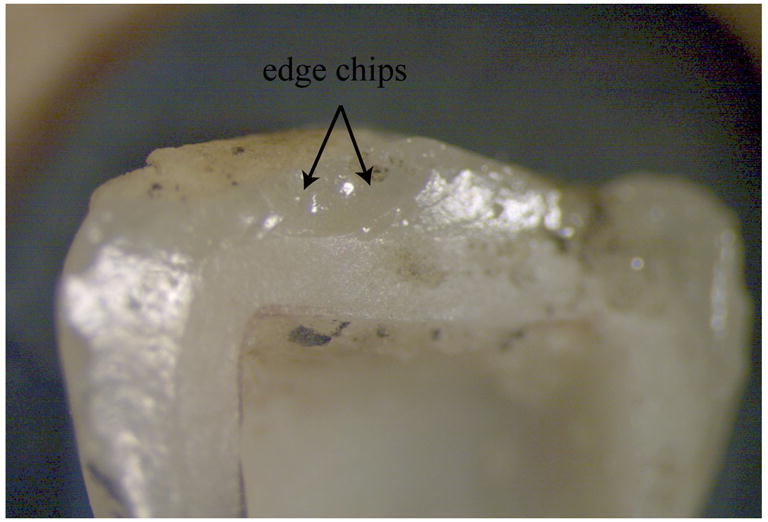
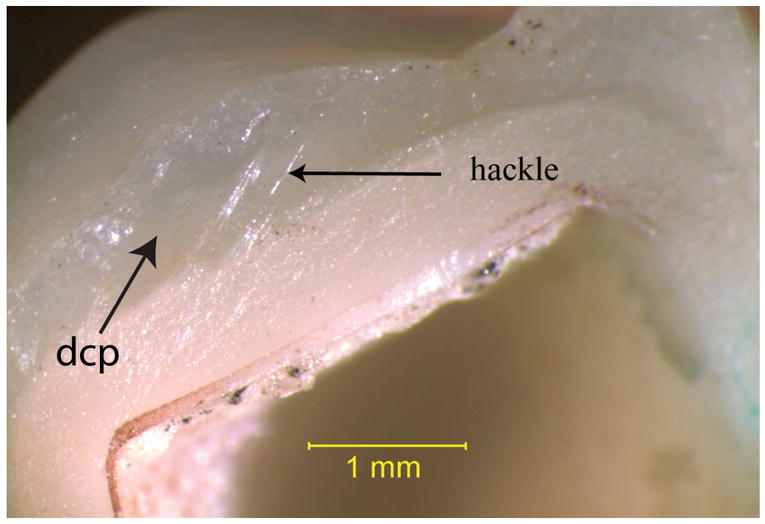
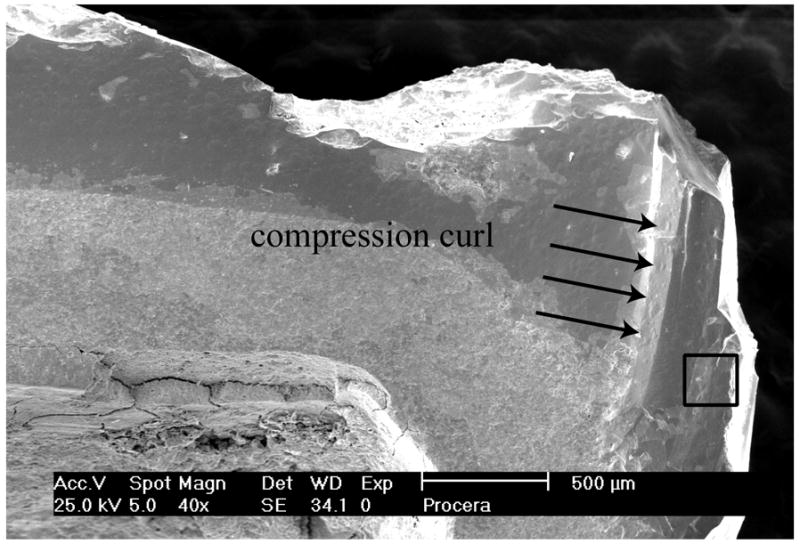
Results: At low magnifications and oblique illumination, the stereomicroscope analysis provided an excellent overview of the fractured topography, showing sites of major interest such as a primary edge chip at a margin, a compression curl indicating the end of the fracture event as well as larger hackle lines distributed over the cracked surface. The greater magnifications with the SEM analysis of the sites of interest showed the presence of wake and twist hackle, indicators of the crack propagation direction. A general map of the fracture events could be reconstructed starting with a primary veneer edge chip at the mesial margin. Hackle and wake hackle of the crack front emanating from this margin arose from hoop stresses and propagated through the full crown thickness towards the distal end of the restoration where the compression curl was located. Additional occlusal surface damage in the form of veneer chipping containing arrest lines and twist hackle running in the opposite direction as the main crack path were observed, but occurred as a secondary event without penetrating the alumina core material.

Significance: Stereo and scanning electron microscopy are complementary analysis techniques useful for the mapping and interpretation of the fracture surface. This case examination is intended to guide the clinical researcher in using qualitative (descriptive) fractography as a tool for understanding the failure process in brittle restorative materials, as well as for assessing possible design inadequacies.


Figures

Fig. 1
Fig. 1
Fig. 1a. Procera AllCeram upper right second premolar crown fracture exposing part of tooth structure and amalgam restoration (Photo: courtesy of Dr. U. Brodbeck, Zurich, Switzerland). Fig. 1b. Recovered part by the patient of the broken Procera AllCeram premolar crown. Fig. 1c. Recovered fractured Procera AllCeram crown part viewed at 16× under the SEM. Zones of interest for detailed fractographic analysis are numbered 1 to 5 starting at the mesial (left) margin to the other side of the crown.
Fig. 1
Fig. 1
Fig. 1a. Procera AllCeram upper right second premolar crown fracture exposing part of tooth structure and amalgam restoration (Photo: courtesy of Dr. U. Brodbeck, Zurich, Switzerland). Fig. 1b. Recovered part by the patient of the broken Procera AllCeram premolar crown. Fig. 1c. Recovered fractured Procera AllCeram crown part viewed at 16× under the SEM. Zones of interest for detailed fractographic analysis are numbered 1 to 5 starting at the mesial (left) margin to the other side of the crown.
Fig. 2
Fig. 2
Fig. 2a. Stereomicroscope image of a mesial marginal edge chip within the veneering ceramic in zone 1 before cleaning the specimen. Note the localized staining covering the chipped ceramic surface. Fig. 2b. Stereomicroscope image of the same chipped zone 1 after cleaning the crown part 10 minutes in an ultrasonic ethanol bath removing the stain. The arrow labeled “dcp” shows the direction of crack propagation.
Fig. 2
Fig. 2
Fig. 2a. Stereomicroscope image of a mesial marginal edge chip within the veneering ceramic in zone 1 before cleaning the specimen. Note the localized staining covering the chipped ceramic surface. Fig. 2b. Stereomicroscope image of the same chipped zone 1 after cleaning the crown part 10 minutes in an ultrasonic ethanol bath removing the stain. The arrow labeled “dcp” shows the direction of crack propagation.
Fig. 3
Fig. 3
Figs. 3a-c. SEM images of the chip in zone 1 at different magnifications. Arrest lines, hackle and wake hackle are recognizable and provide the direction of crack propagation (dcp) as marked by a black arrow from the margin upwards.
Fig. 3
Fig. 3
Figs. 3a-c. SEM images of the chip in zone 1 at different magnifications. Arrest lines, hackle and wake hackle are recognizable and provide the direction of crack propagation (dcp) as marked by a black arrow from the margin upwards.
Fig. 3
Fig. 3
Figs. 3a-c. SEM images of the chip in zone 1 at different magnifications. Arrest lines, hackle and wake hackle are recognizable and provide the direction of crack propagation (dcp) as marked by a black arrow from the margin upwards.
Fig. 4
Fig. 4
Fig. 4a. Stereomicroscope image of zone 2 of interest. Parallel running hackle lines are concentrated in the veneering ceramic. These indicate the direction of crack propagation is from the bottom to top in this view. Figs. 4b,c. Same area as in Fig. 4a viewed under the SEM at higher magnification. Hackle and wake hackle (emanating from pores and inclusions) are easily distinguished and used to indicating the crack was running upwards towards the occlusal side.
Fig. 4
Fig. 4
Fig. 4a. Stereomicroscope image of zone 2 of interest. Parallel running hackle lines are concentrated in the veneering ceramic. These indicate the direction of crack propagation is from the bottom to top in this view. Figs. 4b,c. Same area as in Fig. 4a viewed under the SEM at higher magnification. Hackle and wake hackle (emanating from pores and inclusions) are easily distinguished and used to indicating the crack was running upwards towards the occlusal side.
Fig. 5
Fig. 5
Fig. 5a. Stereomicroscope image focusing on zone 3 showing occlusal surface chip damage. Figs. 5b,c. SEM images at higher magnifications of zone 3. The veneering ceramic surface has occlusal edge chip damage delimited by arrest lines from which emanate fine twist hackle. The concavity of the arrest lines as well as the river pattern of the twist hackle indicate that the direction of crack propagation (dcp) within the edge chip is running from top to bottom (black arrow).
Fig. 5
Fig. 5
Fig. 5a. Stereomicroscope image focusing on zone 3 showing occlusal surface chip damage. Figs. 5b,c. SEM images at higher magnifications of zone 3. The veneering ceramic surface has occlusal edge chip damage delimited by arrest lines from which emanate fine twist hackle. The concavity of the arrest lines as well as the river pattern of the twist hackle indicate that the direction of crack propagation (dcp) within the edge chip is running from top to bottom (black arrow).
Fig. 6
Fig. 6
Figs. 6a,b. Stereomicroscope images of zone 4 showing an array of corner hackle radiating from the core towards the veneer confirmed by wake hackle in the veneer. This radiating fan-like pattern is generated when a crack goes around a corner of a structure. The direction of crack propagation (dcp) is marked by a black arrow.
Fig. 6
Fig. 6
Figs. 6a,b. Stereomicroscope images of zone 4 showing an array of corner hackle radiating from the core towards the veneer confirmed by wake hackle in the veneer. This radiating fan-like pattern is generated when a crack goes around a corner of a structure. The direction of crack propagation (dcp) is marked by a black arrow.
Fig. 7
Fig. 7
Figs. 7a,b. SEM images of zone 5 (distal portion of the crown part) showing a 2 mm in length compression curl in which wake hackle and twist hackle confirm the final breakthrough of the fracture crack.
Fig. 7
Fig. 7
Figs. 7a,b. SEM images of zone 5 (distal portion of the crown part) showing a 2 mm in length compression curl in which wake hackle and twist hackle confirm the final breakthrough of the fracture crack.
Fig. 8
Fig. 8
Figs. 8a,b. Sketched illustration of the stereo findings as well as a summary image of SEM mapping the general direction of crack propagation of the recovered broken Procera AllCeram crown part.
Fig. 8
Fig. 8
Figs. 8a,b. Sketched illustration of the stereo findings as well as a summary image of SEM mapping the general direction of crack propagation of the recovered broken Procera AllCeram crown part.

References

    1. Quinn GD. A NIST recommended practice guide; Special Publication 960–16; National Institute of Standards and Technology; Washington, DC: [May 2007]. Fractography of Ceramics and Glasses. http://www.ceramics.nist.gov/pubs/practice.htm.
    1. ASTM C1322-05a. Annual Book of Standards, Volume 15.01. ASTM International; West Conshohoken, PA: 2005. Standard practice for fractography and characterization of fracture origins in advanced ceramics.
    1. Fischer H, Gröbel J, Marx R. Fraktographische Schadensanalyse an Dentalkeramik. Dtsch Zahnärztl Z. 2000;55:667–70.
    1. Quinn JB, Quinn GD, Kelly JR, Scherrer SS. Fractographic analyses of three ceramic whole crown restoration failures. Dent Mater. 2005;21(10):920–9. - PubMed
    1. Scherrer SS, Quinn JB, Quinn GD, Kelly JR. Failure analysis of ceramic clinical cases using qualitative fractography. Int J Prosthodont. 2006;19(2):185–192. - PubMed

Publication types