. 2008 Mar 5;100(5):359-72.
doi: 10.1093/jnci/djn024. Epub 2008 Feb 26.

Effect of interleukin-8 gene silencing with liposome-encapsulated small interfering RNA on ovarian cancer cell growth

Affiliations

Effect of interleukin-8 gene silencing with liposome-encapsulated small interfering RNA on ovarian cancer cell growth

William M Merritt et al. J Natl Cancer Inst. .

Abstract

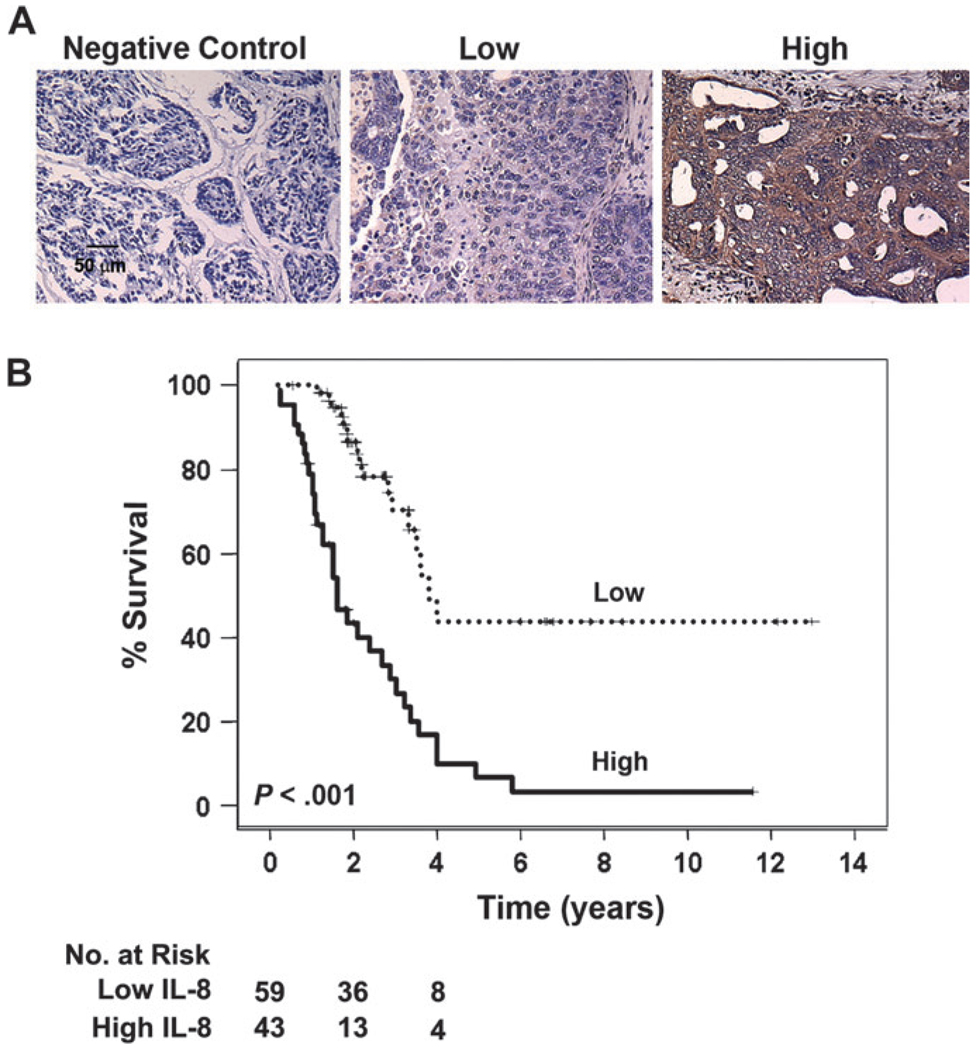
Background: Interleukin-8 (IL-8) is a proangiogenic cytokine that is overexpressed in many human cancers. We investigated the clinical and biologic significance of IL-8 in ovarian carcinoma using human samples and orthotopic mouse models.

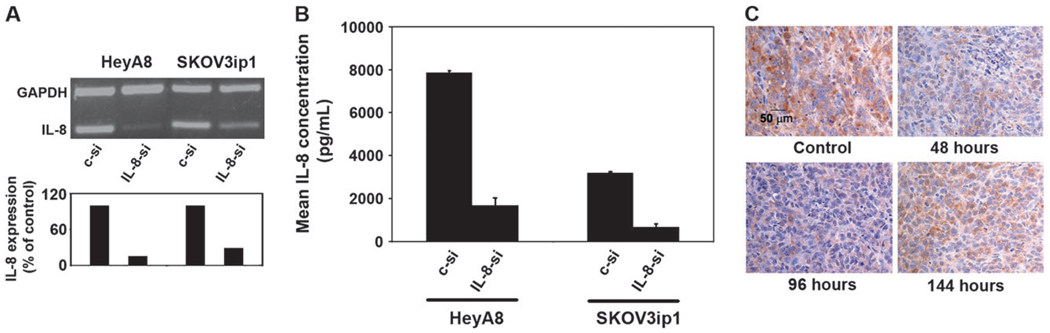
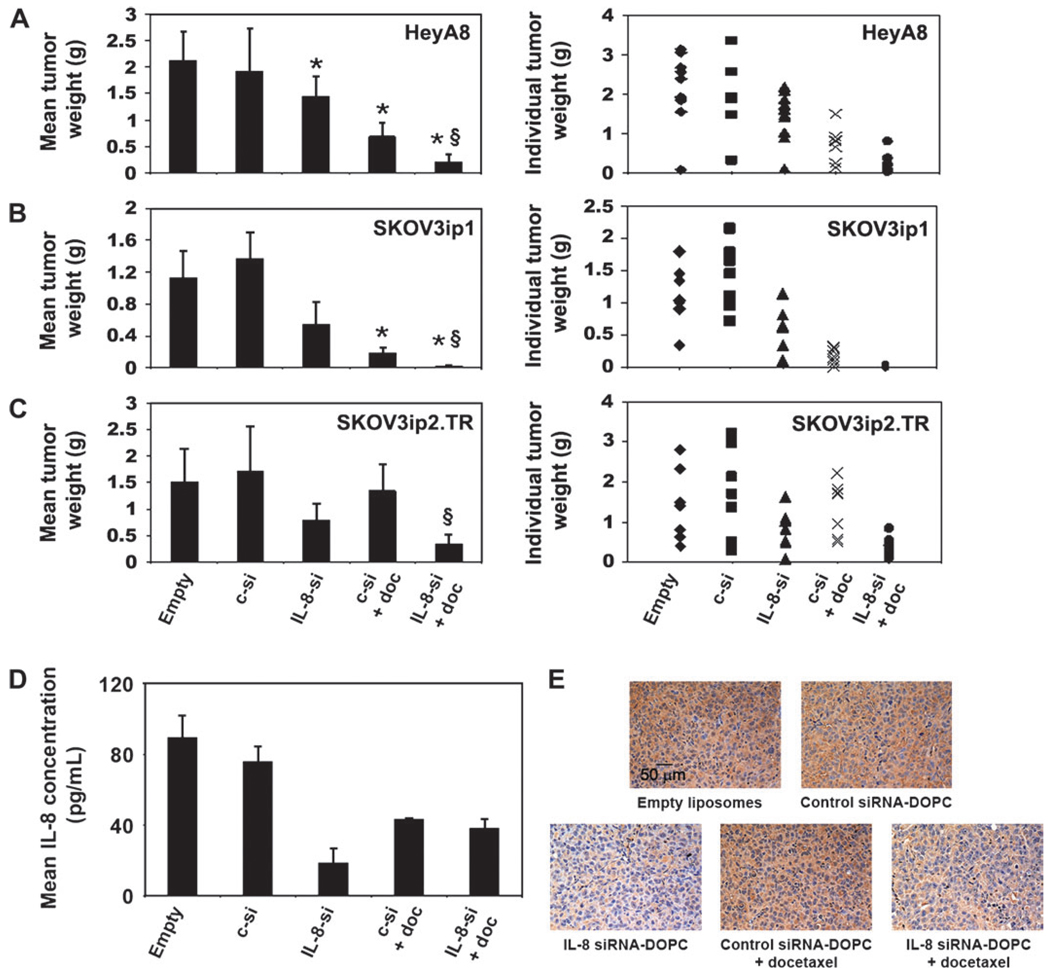
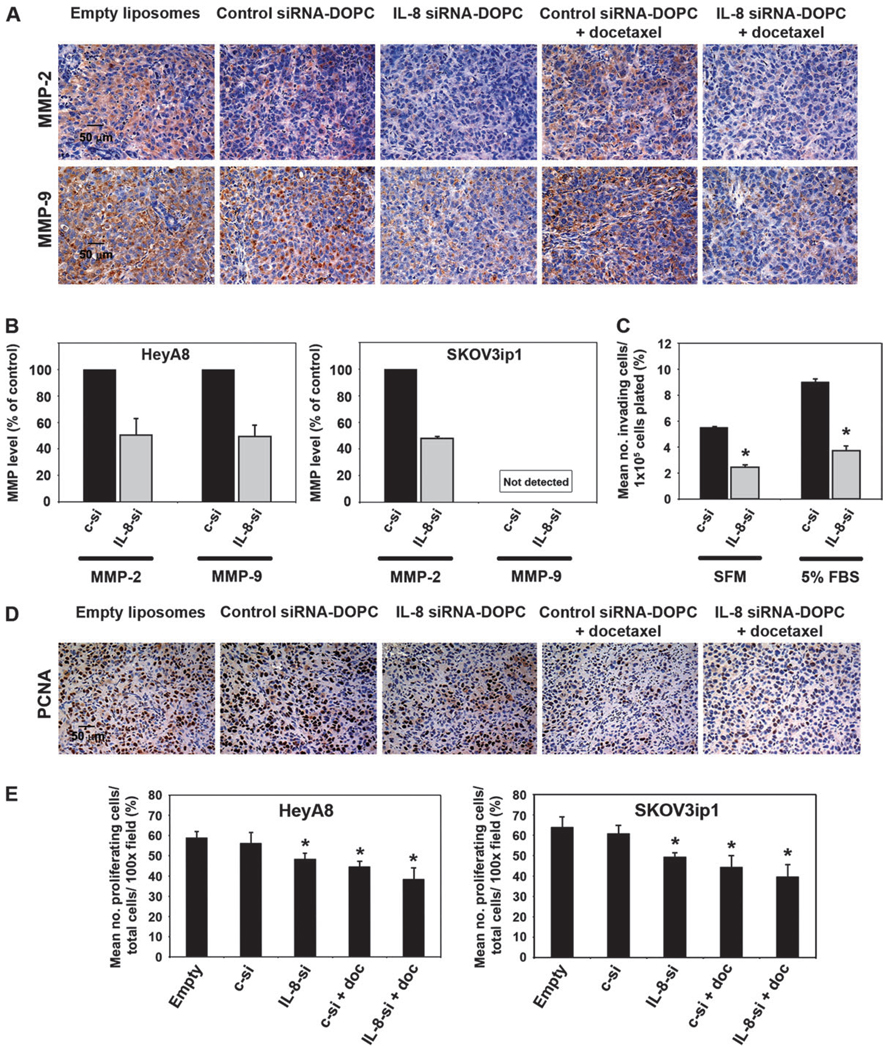
Methods: Tumor expression of IL-8 was assessed by immunohistochemistry among ovarian cancer patients (n = 102) with available clinical and survival data. We examined the effect of IL-8 gene silencing with small interfering RNAs incorporated into neutral liposomes (siRNA-DOPCs), alone and in combination with docetaxel, on in vivo tumor growth, angiogenesis (microvessel density), and tumor cell proliferation in mice (n = 10 per treatment group) bearing orthotopic taxane-sensitive (HeyA8 and SKOV3ip1) and taxane-resistant (SKOV3ip2.TR) ovarian tumors. All statistical tests were two-sided.

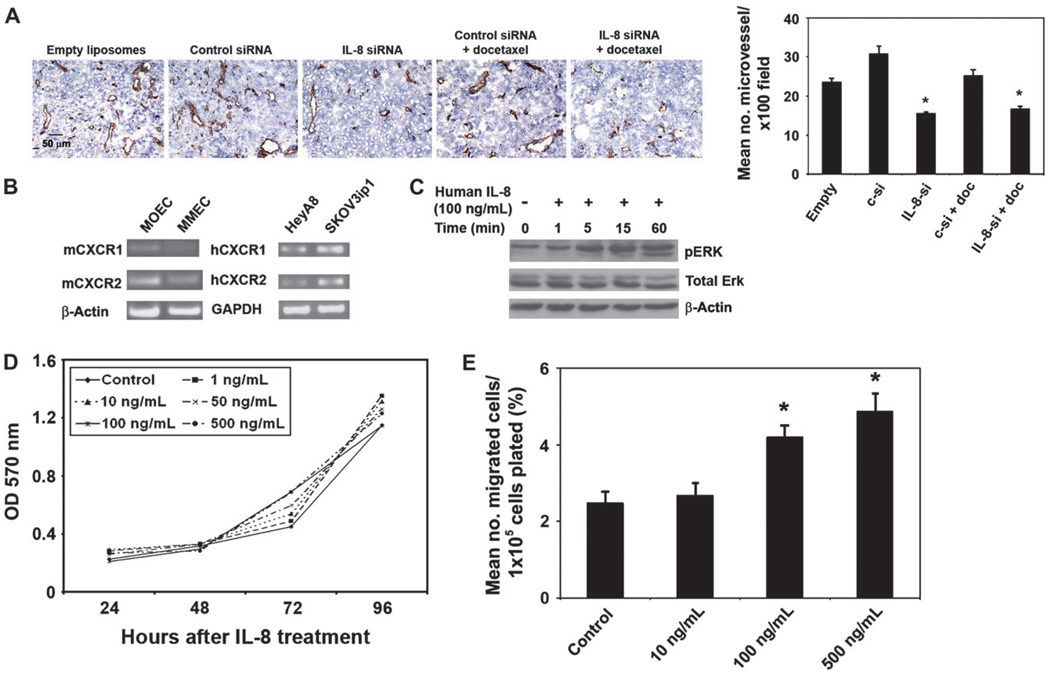
Results: Of the 102 cancer specimens, 43 (42%) had high IL-8 expression and 59 (58%) had low or no IL-8 expression; high IL-8 expression was associated with advanced tumor stage (P = .019), high tumor grade (P = .031), and worse survival (median survival for patients with high vs low IL-8 expression: 1.62 vs 3.79 years; P < .001). Compared with empty liposomes, IL-8 siRNA-DOPC reduced the mean tumor weight by 32% (95% confidence interval [CI] = 14% to 50%; P = .03) and 52% (95% CI = 27% to 78%; P = .03) in the HeyA8 and SKOV3ip1 mouse models, respectively. In all three mouse models, treatment with IL-8 siRNA-DOPC plus the taxane docetaxel reduced tumor growth the most compared with empty liposomes (77% to 98% reduction in tumor growth; P < .01 for all). In the HeyA8 and SKOV3ip1 models, tumors from mice treated with IL-8 siRNA-DOPC alone had lower microvessel density than tumors from mice treated with empty liposomes (HeyA8: 34% lower, 95% CI = 32% to 36% lower [P = .002]; SKOV3ip1: 39% lower, 95% CI = 34% to 44% lower [P = .007]). Compared with empty liposomes, IL-8 siRNA-DOPC plus docetaxel reduced tumor cell proliferation by 35% (95% CI = 25% to 44%; P < .001) and 38% (95% CI = 28% to 48%; P < .001) in the HeyA8 and SKOV3ip1 models, respectively.

Conclusions: Increased IL-8 expression is associated with poor clinical outcome in human ovarian carcinoma, and IL-8 gene silencing decreases tumor growth through antiangiogenic mechanisms.


Figures

Figure 1
Figure 1
Interleukin-8 (IL-8) expression in human ovarian carcinoma. A) Representative images of human ovarian tumors with low and high immunohistochemical staining for IL-8. Negative control represents a sample of ovarian cancer tissue used in the current study processed for immunohistochemistry with the secondary antibody alone. Immunohistochemistry staining of cell nuclei (blue) and IL-8 (brown) are represented in photo images. B) Kaplan–Meier curves of disease-specific mortality for patients whose ovarian tumors expressed high and low levels of IL-8. The log-rank test (two-sided) was used to compare differences between groups. Survival probabilities and 95% confidence intervals (CIs) at 2 and 4 years for low IL-8 expression were 86% (95% CI = 76% to 94%) and 44% (95% CI = 24% to 64%), respectively, and for high IL-8 expression were 43% (95% CI = 28% to 59%) and 13% (95% CI = 4% to 27%), respectively.
Figure 2
Figure 2
Silencing of interleukin-8 (IL-8) gene expression with siRNA in vitro and in vivo. HeyA8 and SKOV3ip1 ovarian cancer cells were transfected with control siRNA (c-si) or IL-8 siRNA (IL-8-si) in vitro and were analyzed 36–48 hours later for IL-8 mRNA and protein expression. A) Reverse transcription–polymerase chain reaction (RT-PCR) analysis of IL-8 mRNA expression. Glyceraldehyde-3-phosphate dehydrogenase (GAPDH) was used as a control. The graph represents a densitometry analysis of IL-8 expression in the RT-PCR image (band intensities for respective samples were normalized to GAPDH levels). B) Enzyme-linked immunosorbent assay of IL-8 protein expression. Mean IL-8 protein concentrations for three replicates are shown. Error bars correspond to 95% confidence intervals. C) In vivo dose–response experiment examining efficacy of liposome-encapsulated IL-8 siRNA (IL-8 siRNA-DOPC) in nude mice bearing orthotopic HeyA8 tumors. Approximately 17 days after injection of HeyA8 cells (when tumors were palpable), mice were treated with a single dose of 3.5 (demonstrated in figure) or 5 µg IL-8 siRNA-DOPC. Tumors were harvested from mice treated with empty liposomes (control) and at 48, 96, and 144 hours after IL-8 siRNA-DOPC injection and analyzed for IL-8 expression by immunohistochemistry. Immunohistochemical staining of cell nuclei (blue) and IL-8 (brown) are represented in photo images.
Figure 3
Figure 3
Effect of interleukin-8 (IL-8) siRNA-DOPC therapy on tumor weight and IL-8 protein expression in mouse orthotopic tumor models. Nude mice were injected with HeyA8 (A), SKOV3ip1 (B), or taxane-resistant SKOV3ip2.TR (C) ovarian cancer cells and, 1 week later, were randomly assigned (10 mice per group) to receive therapy with 1) empty liposomes (empty); 2) control siRNA-DOPC (c-si); 3) IL-8 siRNA-DOPC (IL-8-si); 4) control siRNA-DOPC plus docetaxel (c-si + doc); or 5) IL-8 siRNA-DOPC plus docetaxel (IL-8-si + doc). Mice were killed by cervical dislocation when the mice in either the control or a treatment group became moribund (HeyA8: 27 days; SKOV3ip1: 38 days; SKOV3ip2.TR: 56 days), and tumor weight and disease location were recorded. Mean tumor weight with 95% confidence intervals (error bars; left panels) and corresponding tumor weight distributions for each mouse model are shown (right panels). Statistical analysis for tumor weights was performed by Student’s t test (between two groups) and analysis of variance (multiple groups) because tumor weights were normally distributed (determined by Kolmogrov–Smirnov test). * statistically significantly different from the empty liposome treatment group. P values for HeyA8 (IL-8: P = .03; control siRNA + doc: P = .003; IL-8 siRNA + doc: P = .001); SKOV3ip1 (IL-8: P = .03; control siRNA + doc: P = .001; IL-8 siRNA + doc: P < .001). § represents statistically significantly different weights for treatment with IL-8 siRNA-DOPC plus docetaxel compared with treatment with control siRNA-DOPC plus docetaxel. P values for HeyA8 = .006, SKOV3ip1 = .005, SKOV3ip2.TR =.004. D) Enzyme-linked immunosorbent assay of circulating serum IL-8 levels during IL-8 siRNA-DOPC therapy in the HeyA8 model. Forty-eight hours after siRNA-DOPC injection, whole-blood samples (from 4 mice per treatment group) were obtained from tail veins and pooled and aliquoted into three wells per treatment group for analysis. Values represent mean serum IL-8 levels; error bars correspond to 95% confidence intervals. E) Immunohistochemical analysis of IL-8 expression in HeyA8 tumors harvested at completion of IL-8 siRNA-DOPC therapy with or without docetaxel. Immunohistochemical staining represents cell nuclei (blue) and IL-8 (brown) in photo images.
Figure 4
Figure 4
Effect of interleukin-8 (IL-8) siRNA-DOPC therapy on tumor angiogenesis. A) Tumor vascularity was assessed by immunohistochemical staining for CD31 antigen in tumors from the HeyA8 and SKOV3ip1 therapy experiments. Photomicrographs represent CD31 staining in tumors from HeyA8 model (original magnification ×100). Immunohistochemical staining represents murine endothelial cells (brown) and tumor cell nuclei (blue) in photo image. The graph (right panel) shows the mean microvessel density from each treatment group. Mean microvessel density was calculated by averaging vessel counts from five random fields per slide (each slide represents tumor from one mouse); at least three slides per treatment group were examined. Error bars represent 95% confidence intervals. Comparison between groups was performed by Student’s t test and analysis of variance (normal distribution confirmed by the Kolmogrov–Smirnov test). * statistically significant decrease in microvessel density compared with the empty liposome group (IL-8-DOPC siRNA: P = .002 and IL-8 siRNA-DOPC plus docetaxel [IL-8-si + doc]: P = .002). c-si = control siRNA-DOPC; c-si + doc = control siRNA-DOPC plus docetaxel. B) Expression of murine CXCR1 (mCXCR1) and 2 (mCXCR2) mRNAs was examined in murine mesentery endothelial cells (MMECs) and murine ovarian endothelial cells (MOECs) by reverse transcription–polymerase chain reaction. Human CXCR1 and 2 (hCXCR1 and hCXCR2, respectively) mRNA expression was also examined in HeyA8 and SKOV3ip1 ovarian cancer cell lines. β actin and glyceraldehyde-3-phosphate dehydrogenase (GAPDH) were used as loading controls for the mouse and human cell lines, respectively. C) Immunoblot analysis of phosphorylated ERK 1/2 and total ERK at multiple time points following treatment of MMECs with human recombinant IL-8. Immunoblotting for total actin was performed to confirm equal loading. D) Cell proliferation assay. MMEC proliferation was assessed by 3-(4,5-dimethylthiazol-2-yl)-2,5-diphenyl tetrazolium bromide at various time points after treatment with human recombinant IL-8 (Control = no treatment). Mean values for the measured optical density at 570 nm for eight replicates are shown. E) Effects of human recombinant IL-8 on murine endothelial cell migration. MMECs (1 × 10⁵) were placed in the top wells of a membrane invasion culture system, and various concentrations of IL-8 (10, 100, 500 ng/mL) were placed in the bottom wells as chemoattractants. After a 6-hour incubation at 37°C, the number of cells that had migrated into the bottom wells was counted (three wells per IL-8 concentration) and expressed as a mean percentage of the total number of cells plated (Control = media only as chemoattractant). Error bars represent 95% confidence intervals. Comparisons between treatment groups were performed by Student’s t test (normal distribution confirmed with the Kolmogrov–Smirnov test). * P < .001 compared with control.
Figure 5
Figure 5
Effect of interleukin−8 (IL-8)–targeted therapy on matrix metalloproteinase (MMP) expression and tumor cell proliferation in mouse orthotopic tumor models. A) Immunohistochemical analysis of MMP-2 and MMP-9 expression in HeyA8 tumors harvested at the completion of IL-8 siRNA-DOPC therapy with or without docetaxel. Representative images (original magnification ×100) are shown: cell nuclei (blue) and MMP-2 and MMP-9 (brown). B) Enzyme-linked immunosorbent assay of MMP-2 and MMP-9 expression in HeyA8 and SKOV3ip1 cell lines transfected for 48 hours with IL-8 siRNA. The mean percentage of MMP-2 and MMP-9 expression in IL-8 siRNA (IL-8-si) transfected cells compared with that in cells transfected with control siRNA (c-si) for assays performed in triplicate is shown. Error bars represent 95% confidence intervals. C) HeyA8 cell invasion assay. HeyA8 cells were transfected with IL-8 siRNA or control siRNA for 24 hours and then seeded (1 × 10⁵ cells) into the top wells of a membrane invasion culture system; the bottom wells contained serum-free medium (SFM) or medium containing 5% fetal bovine serum (FBS). Average percentage of cells that had invaded the membrane separating the top and bottom wells after 24 hours is shown (three wells per treatment condition). Error bars represent 95% confidence intervals. Student’s t test used to compare differences between two groups (normal distribution of data was confirmed by the Kolmogrov–Smirnov test). * P < .001 compared with control siRNA in both conditions. D) Immunohistochemical staining for proliferating cell nuclear antigen (PCNA) to assess cell proliferation in HeyA8 and SKOV3ip1 tumors collected at completion of IL-8 siRNA-DOPC therapy (original magnification ×100). E) Quantitation of tumor cell proliferation. Immunohistochemical staining represents nonproliferating tumor cell nuclei (blue) and proliferating tumor cell nuclei (brown) in photo image. In the graph, the percentage of proliferating cells was obtained by calculating the number of proliferating tumor cells divided by total number of cells on each field. The mean percentage was calculated by examining five random fields per slide (1 slide = 1 mouse) and three slides per treatment group. Error bars represent 95% confidence intervals. Treatment arms were compared by Student’s t test (normal distribution). * P < .001 compared with the empty liposome group.

Similar articles

Cited by

References

    1. Cancer Facts and Figures 2007. Atlanta, GA: American Cancer Society; [Accessed January 3, 2008]. www.cancer.org.
    1. Jain RK, Duda DG, Clark JW, Loeffler JS. Lessons from phase III clinical trials on anti-VEGF therapy for cancer. Nat Clin Pract Oncol. 2006;3(1):24–40. - PubMed
    1. Ferrara N. The role of VEGF in the regulation of physiological and pathological angiogenesis. EXS. 2005;(94):209–231. - PubMed
    1. Cooper BC, Ritchie JM, Broghammer CL, et al. Preoperative serum vascular endothelial growth factor levels: significance in ovarian cancer. Clin Cancer Res. 2002;8(10):3193–3197. - PubMed
    1. Lee JC, Chow NH, Wang ST, Huang SM. Prognostic value of vascular endothelial growth factor expression in colorectal cancer patients. Eur J Cancer. 2000;36(6):748–753. - PubMed

Publication types

MeSH terms