. 2008 Feb;20(2):452-70.
doi: 10.1105/tpc.107.054718. Epub 2008 Feb 26.

Tocopherols modulate extraplastidic polyunsaturated fatty acid metabolism in Arabidopsis at low temperature

Affiliations

Tocopherols modulate extraplastidic polyunsaturated fatty acid metabolism in Arabidopsis at low temperature

Hiroshi Maeda et al. Plant Cell. 2008 Feb.

Abstract

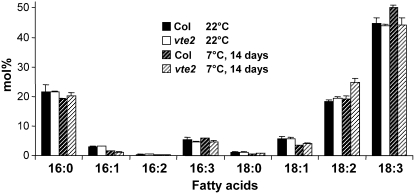
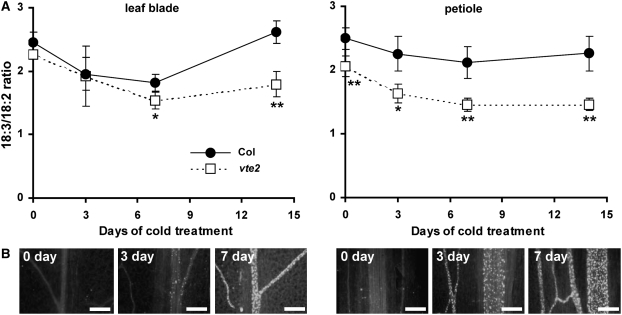
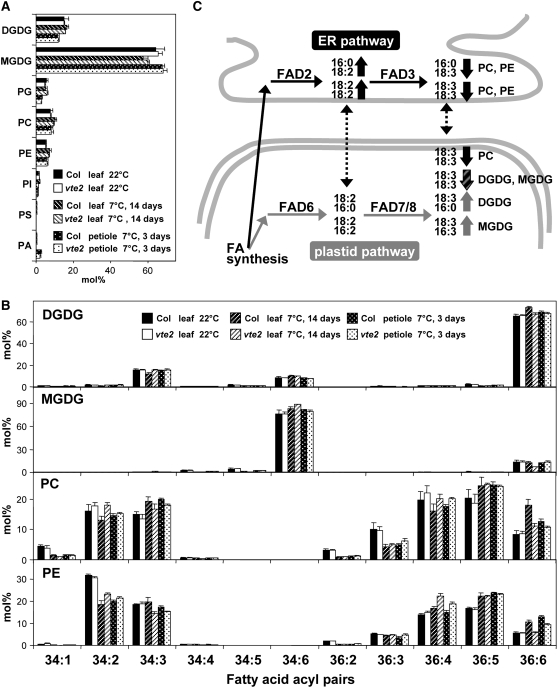
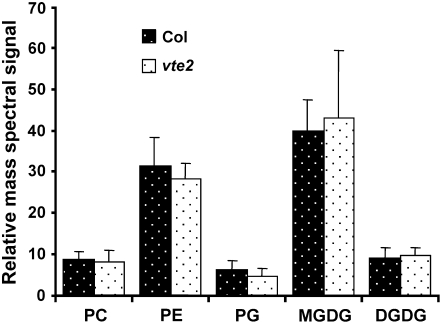
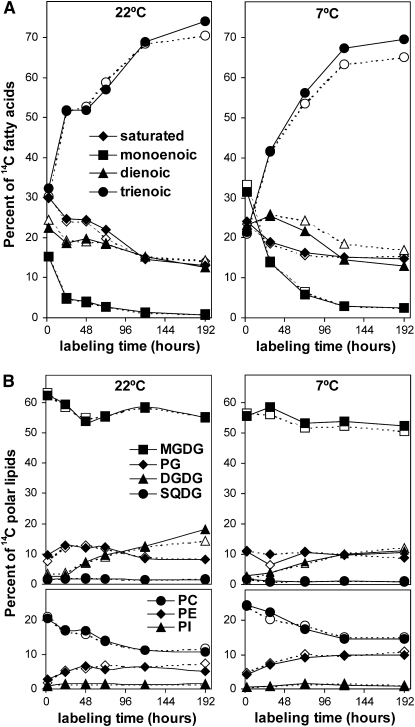
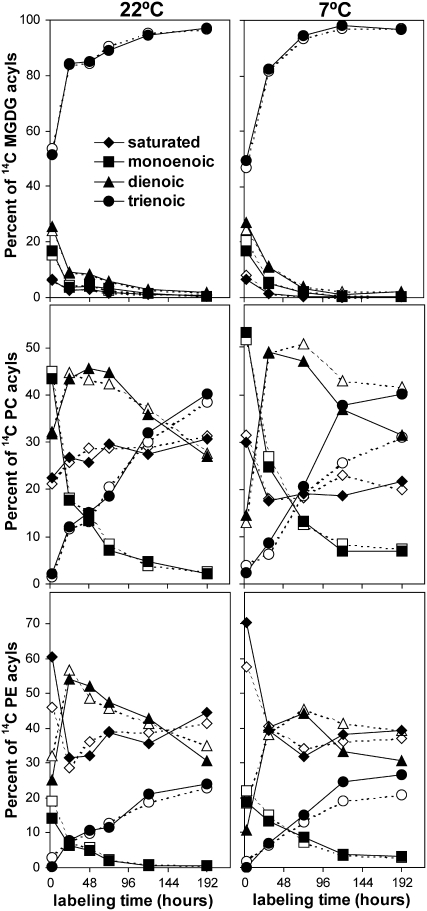
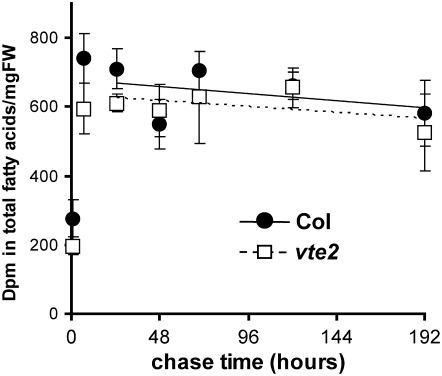
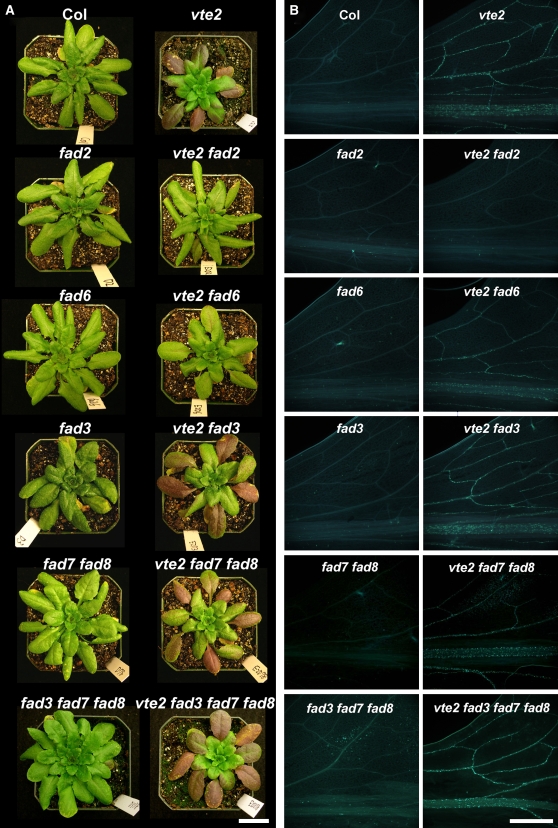
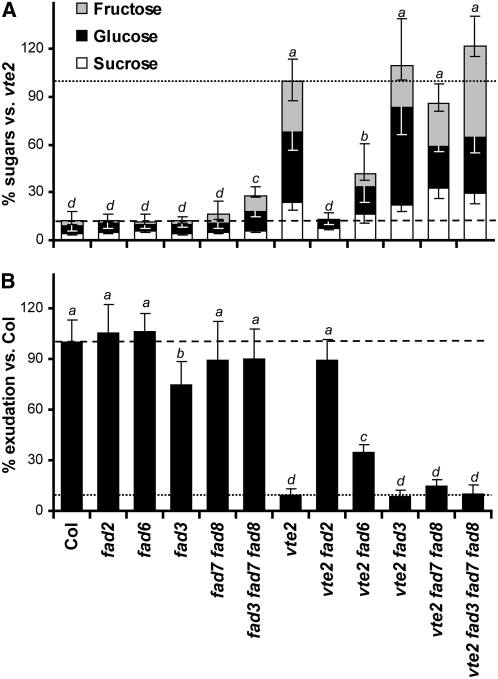
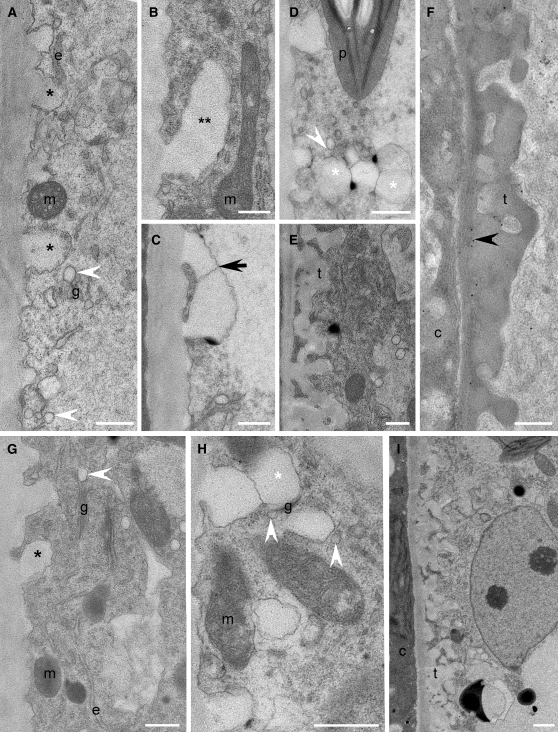
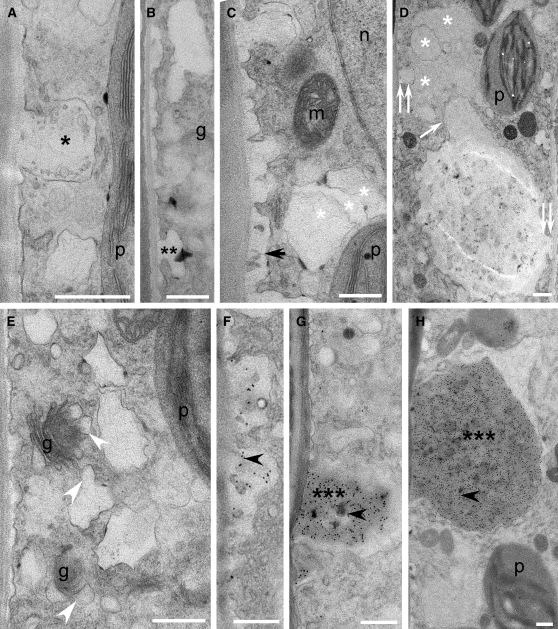
Tocopherols (vitamin E) are synthesized in plastids and have long been assumed to have essential functions restricted to these organelles. We previously reported that the vitamin e-deficient2 (vte2) mutant of Arabidopsis thaliana is defective in transfer cell wall development and photoassimilate transport at low temperature (LT). Here, we demonstrate that LT-treated vte2 has a distinct composition of polyunsaturated fatty acids (PUFAs): lower levels of linolenic acid (18:3) and higher levels of linoleic acid (18:2) compared with the wild type. Enhanced 18:3 oxidation was not involved, as indicated by the limited differences in oxidized lipid species between LT-treated vte2 and the wild type and by a lack of impact on the LT-induced vte2 phenotype in a vte2 fad3 fad7 fad8 quadruple mutant deficient in 18:3. PUFA changes in LT-treated vte2 occur primarily in phospholipids due to reduced conversion of dienoic to trienoic fatty acids in the endoplasmic reticulum (ER) pathway. Introduction of the ER fatty acid desaturase mutation, fad2, and to a lesser extent the plastidic fad6 mutation into the vte2 background suppressed the LT-induced vte2 phenotypes, including abnormal transfer cell wall development. These results provide biochemical and genetic evidence that plastid-synthesized tocopherols modulate ER PUFA metabolism early in the LT adaptation response of Arabidopsis.


Figures

Figure 1.
Figure 1.
Total Fatty Acid Composition of Col and vte2 Leaves before and after 14 d of LT Treatment. Col and vte2 plants were grown at 22°C for 4 weeks, and the middle portions of mature leaf blades were harvested for analysis before and after 14 d of 7°C treatment. Values for each fatty acid (x:y represents number of carbons:number of unsaturated bonds) are means ± sd (n = 4 biological replicates) and are expressed as mol %.
Figure 2.
Figure 2.
18:3/18:2 Ratio and Callose Deposition in the Petioles and Leaf Blades of Col and vte2 during LT Treatment. Col and vte2 plants were grown at 22°C for 4 weeks and then transferred to 7°C for an additional 14 d. (A) Fatty acid composition of total lipid extracts was analyzed from the middle portions of leaf blades (left graph) and petioles (right graph) of Col (closed circles) and vte2 (open squares). Data are means ± sd (n = 4 biological replicates). Asterisks represent significance levels using Student's t test of vte2 relative to Col at each time point (* P < 0.05; ** P < 0.01). (B) Aniline blue–positive fluorescence of vte2 leaf blades (left) and petioles (right) of vte2 after 0, 3, and 7 d of LT treatment. Bars = 100 μm.
Figure 3.
Figure 3.
Lipid Profiles of Col and vte2 Leaves and Petioles before and after 14 d of LT Treatment. (A) and (B) Col and vte2 were grown at 22°C for 4 weeks and then transferred to 7°C. Black and white bars are Col and vte2 leaves, respectively, before LT treatment. White-hatched and black-hatched bars are Col and vte2 leaves, respectively, after 14 d of LT treatment. White-dotted and black-dotted bars are Col and vte2 petioles, respectively, after 3 d of LT treatment. Values are means ± sd (n = 5 biological replicates) and are expressed as mol %. PI, phosphatidylinositol; PS, phosphatidylserine; PA, phosphatidic acid; FA, fatty acid. (A) Mole percent of total polar lipid classes analyzed. (B) Mole percent of fatty acids esterified to DGDG, MGDG, PC, and PE. (C) A diagram summarizing membrane PUFA biosynthesis in Arabidopsis and the PUFA-containing lipid molecular species (e.g., PC and PE with 16:0 and 18:3 acyls shown at the right top corner) that are higher (up arrows) and lower (down arrows) in LT-treated vte2 relative to Col. Black and gray arrows indicate acyl pairs derived from the ER and plastid pathways, respectively, while the striped arrow indicates lipid species that can be produced from both pathways. Dotted arrows illustrate proposed transfer of lipids between the ER and plastid.
Figure 4.
Figure 4.
Oxylipin-Containing Polar Lipid Species in 3-d LT-Treated Col and vte2 Petioles. Compounds containing 18-carbon oxygenated fatty acyl anions were analyzed by mass spectrometry as described in Methods. White- and black-dotted bars are Col and vte2 petioles, respectively, after 3 d of LT treatment. Data include 34 molecular species (9 PC, 10 PE, 3 PG, 7 MGDG, and 5 DGDG) with oxygenated 18-carbon fatty acids; details about the analyzed species are given in Supplemental Figure 1 online. Values are means ± sd (n = 5 biological replicates). No significant differences were observed in all cases between genotypes (Student's t test, P > 0.05).
Figure 5.
Figure 5.
Redistribution of Radioactivity among the Fatty Acids and Polar Lipids of Col and vte2 at 22 or 7°C. Col (closed symbols) and vte2 (open symbols) were grown at 22°C for 4 weeks, labeled with [14C]-acetate at 22°C at time zero, and harvested for the first time point 2 h later, after which time the labeled plants were either kept at 22°C (left graphs) or transferred to 7°C (right graphs) for the indicated times. All experiments were repeated three times with similar trends. Representative data are shown. (A) Redistribution of radioactivity among individual fatty acids. diamonds, saturated; squares, monoenoic; triangles, dienoic; circles, trienoic fatty acids. (B) Redistribution of radioactivity among individual polar lipids. Top panels: squares, MGDG; diamonds, PG; triangles, DGDG; circles, SQDG (sulfoquinovosyldiacylglycerol). Bottom panels: circles, PC; diamonds, PE; triangles, PI.
Figure 6.
Figure 6.
Redistribution of Radioactivity among Fatty Acids of Individual Lipids from Col and vte2 at 22 or 7°C. Col (closed symbols) and vte2 (open symbols) were treated and labeled as in Figure 5. Redistribution of radioactivity among individual fatty acid methylesters of MGDG, PC, or PE was analyzed by TLC. All experiments were repeated three times, except for 7°C MGDG and PE, which were repeated two times. All experiments showed similar trends, and representative data are shown. For the 7°C experiment, an additional experiment was also conducted using 3-d LT-treated plants, and similar but more obvious trends were observed (see Supplemental Figure 2 online). Diamonds, saturated; squares, monoenoic; triangles, dienoic; circles, trienoic fatty acids.
Figure 7.
Figure 7.
14CO2 Pulse Chase Labeling of Total Fatty Acids in LT-Treated Col and vte2. Col (closed circles) and vte2 (open squares) grown at 22°C for 3 weeks were transferred to 7°C for 3 d and then pulse labeled with 14CO2 for 30 min and chased in air at 7°C. At the indicated times, leaf samples were harvested and the specific activity in total fatty acids determined. Samples for the initial time point were taken immediately after labeling (30 min). Values are means ± sd (n = 3 biological replicates) and are expressed as radioactivity detected in total fatty acids per mg fresh weight (FW). Estimated rates of fatty acid turnover are indicated as the slopes of solid (Col) and dotted (vte2) lines based on values starting at the 24-h time point.
Figure 8.
Figure 8.
Visible Phenotype and Callose Deposition of LT-Treated Col, vte2, and a Series of fad and vte2-Containing fad Mutants. All genotypes were grown at 22°C for 4 weeks and then transferred to 7°C. (A) Representative plants of the indicated genotypes after 4 weeks of LT treatment. Bar = 2 cm. (B) Aniline blue–positive fluorescence in the lower half of the leaves after 3 d of LT treatment. Bar = 1 mm.
Figure 9.
Figure 9.
Soluble Sugar Content and Photoassimilate Export Capacity of LT-Treated Col, vte2, and a Series of fad and vte2-Containing fad Mutants. All genotypes were grown at 22°C for 4 weeks and then transferred to 7°C. Nonsignificant groups are indicated by alphabetical order with a being the highest (analysis of variance, P < 0.05). (A) After 14 d of LT treatment, mature leaves of the indicated genotypes were harvested at the end of the light cycle and analyzed for total soluble sugar content (i.e., glucose, black; fructose, gray; sucrose, white). Values are means ± sd (n = 4 or 5 biological replicates) and expressed as percentage of the vte2 value (256.6 ± 39.6 μmol/gFW). (B) After 7 d of LT treatment, mature leaves of the indicated genotypes were labeled with 14CO2 in the middle of the day, and 14C-labeled photoassimilate exudation was analyzed as described (Maeda et al., 2006). Data are means ± sd (n = 5 or 6 biological replicates) and expressed as percentage of the Col value (18.1% ± 3.1% 14C exudated per total 14C fixed).
Figure 10.
Figure 10.
Cellular Structure, Cell Wall Development, and Immunodetection of β-1,3-Glucan in Col and vte2 fad2 after 3 d of LT Treatment. (A) to (F) Col. (G) to (I) vte2 fad2. (A) to (I) Immunodetection of β-1,3-glucan. Single black asterisks mark nascent transfer cell wall papillae ([A] and [G]). Double asterisks mark laterally elongating nascent papillate ingrowth (B). Black arrow marks fused, elongated papillae (C). White asterisks mark spherical wall ingrowths that have developed on preexisting wall ingrowths ([D] and [H]). White arrowheads mark Golgi-derived vesicles ([A], [D], [G], and [H]). Black arrowhead marks positive immunodetection of β-1,3-glucan (F). c, companion cell; e, endoplasmic reticulum; g, Golgi; m, mitochondrion; p, plastid, t, transfer cell wall. Bars = 0.5 μm.
Figure 11.
Figure 11.
Cellular Structure, Cell Wall Development, and Immunodetection of β-1,3-Glucan in vte2 after 3 d of LT Treatment. (A) to (H) vte2. g, Golgi; m, mitochondrion; n, nucleus; p, plastid. Bars = 0.5 μm. (A) and (F) to (H) Immunodetection of β-1,3-glucan. (A) Single black asterisk marks nascent transfer cell wall papilla. (B) Double asterisks label laterally elongating nascent papillate ingrowth. (C) Black arrow marks fused, elongated papillae. (C) and (D) White asterisks mark hypertrophied, deformed wall ingrowths that have developed on preexisting wall ingrowths during early (C) and later stages (D) of development. (D) White arrow marks two coalesced ingrowths with origins on opposite sides of the cell as indicated by double white arrowheads. (E) White arrowheads mark swollen, misshapen Golgi-derived vesicles. (F) to (H) Black arrowheads mark positive immunodetection of β-1,3-glucan following fusion of laterally elongated papilla (F), through to the development of continuously enlarging tumor-like ingrowths marked by triple black asterisks ([G] and [H]).

Comment in

  • Tocopherols and ER fatty acid metabolism.
    Eckardt NA. Eckardt NA. Plant Cell. 2008 Feb;20(2):246. doi: 10.1105/tpc.108.200212. Epub 2008 Feb 26. Plant Cell. 2008. PMID: 18314498 Free PMC article. No abstract available.

References

    1. Andersson, M.X., Goksor, M., and Sandelius, A.S. (2006). Optical manipulation reveals strong attracting forces at membrane contact sites between endoplasmic reticulum and chloroplasts. J. Biol. Chem. 282 1170–1174. - PubMed
    1. Aubert, S., Gout, E., Bligny, R., Marty-Mazars, D., Barrieu, F., Alabouvette, J., Marty, F., and Douce, R. (1996). Ultrastructural and biochemical characterization of autophagy in higher plant cells subjected to carbon deprivation: control by the supply of mitochondria with respiratory substrates. J. Cell Biol. 133 1251–1263. - PMC - PubMed
    1. Bagnall, N., Wang, X.D., Scofield, G.N., Furbank, R.T., Offler, C.E., and Patrick, J.W. (2000). Sucrose transport-related genes are expressed in both maternal and filial tissues of developing wheat grains. Aust. J. Plant Physiol. 27 1009–1020.
    1. Bonaventure, G., Ba, X.M., Ohlrogge, J., and Pollard, M. (2004). Metabolic responses to the reduction in palmitate caused by disruption of the FATB gene in Arabidopsis. Plant Physiol. 135 1269–1279. - PMC - PubMed
    1. Bonnemain, J.L., Borguin, S., Renault, S., Offler, C.E., and Fincher, G.B. (1991). Transfer cells: Structure and physiology. In Recent Advances in Phloem Transport and Assimilate Compartmentation, L. Bonnemain and S. Delrot, eds (Paris: Presses Académiques), pp. 74–83.

Publication types