. 2008 Aug;216(2):486-97.
doi: 10.1002/jcp.21420.

Alpha-1 adrenergic receptor transactivates signal transducer and activator of transcription-3 (Stat3) through activation of Src and epidermal growth factor receptor (EGFR) in hepatocytes

Affiliations

Alpha-1 adrenergic receptor transactivates signal transducer and activator of transcription-3 (Stat3) through activation of Src and epidermal growth factor receptor (EGFR) in hepatocytes

Chang Han et al. J Cell Physiol. 2008 Aug.

Abstract

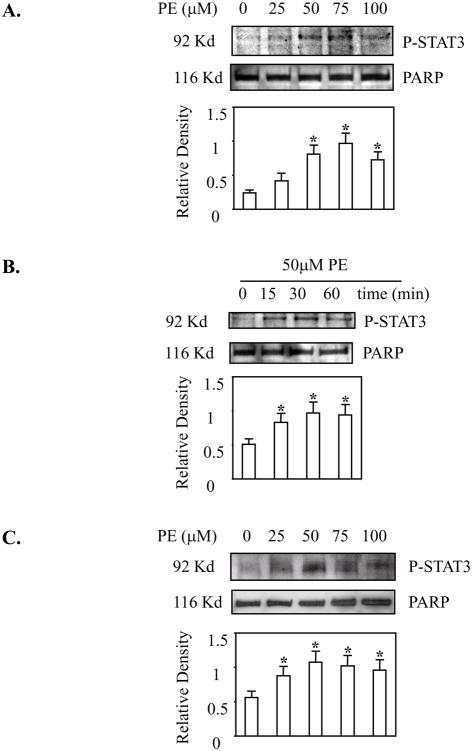
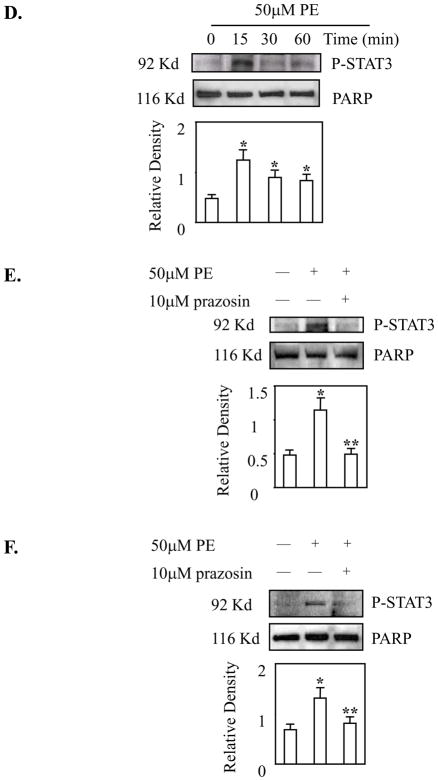
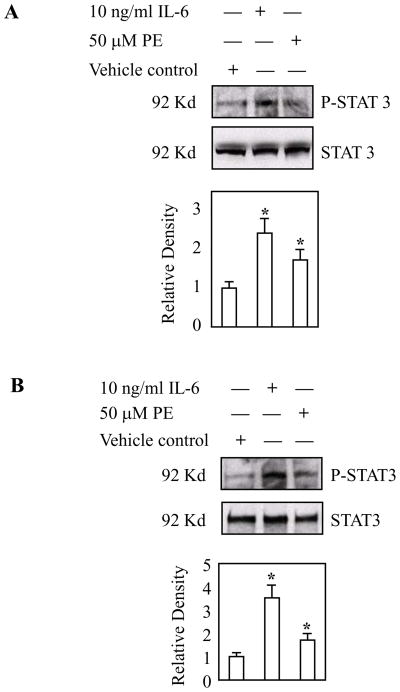
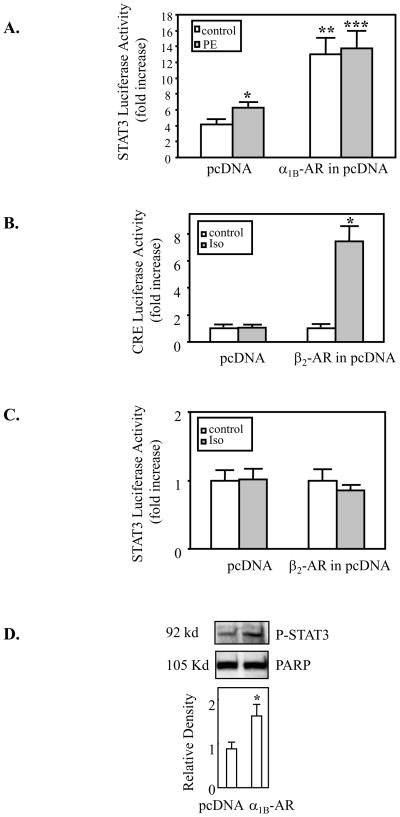
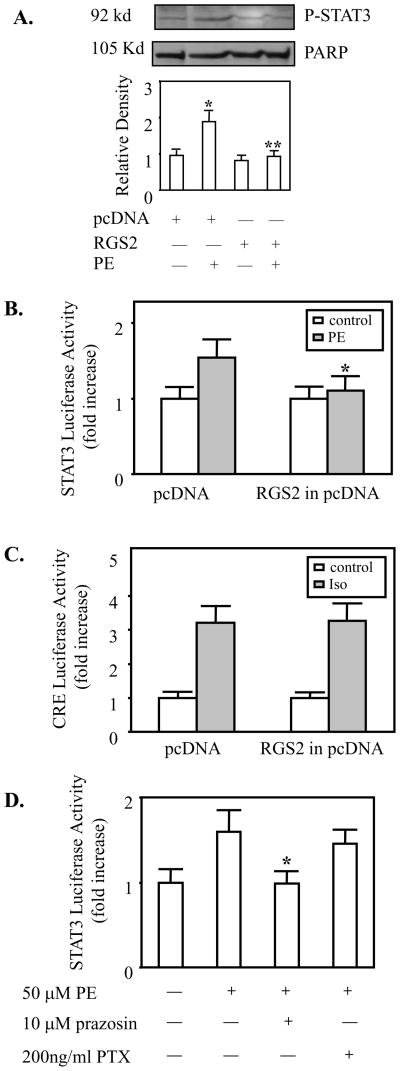
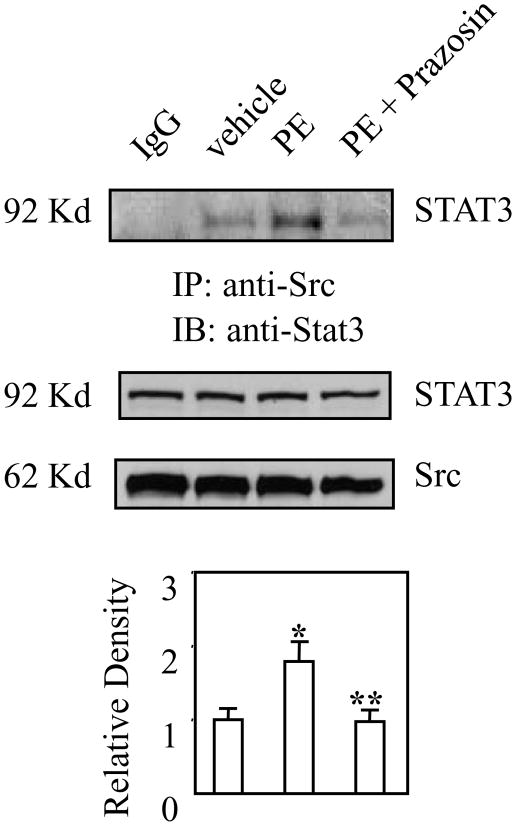
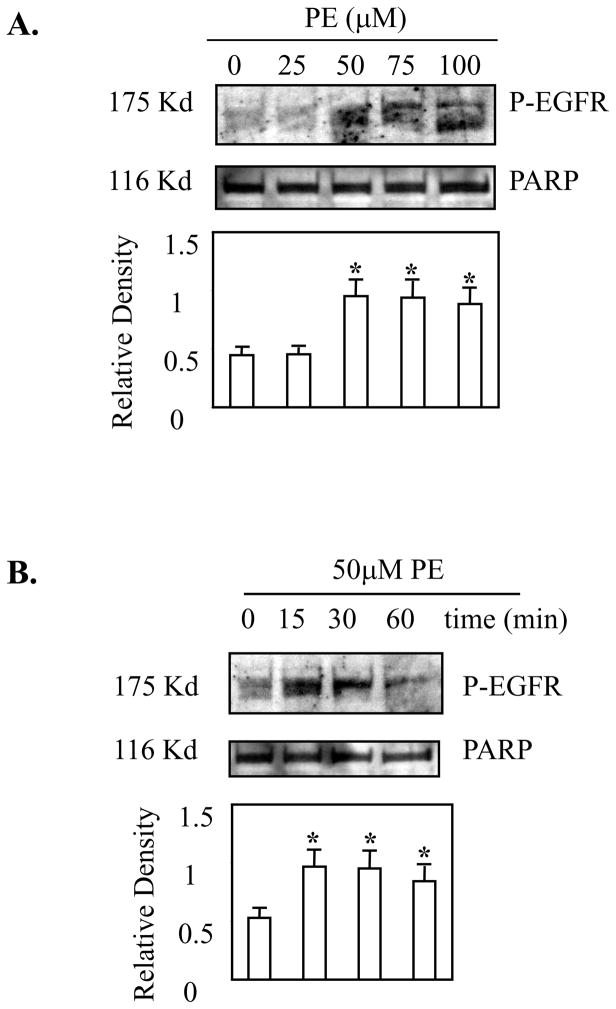
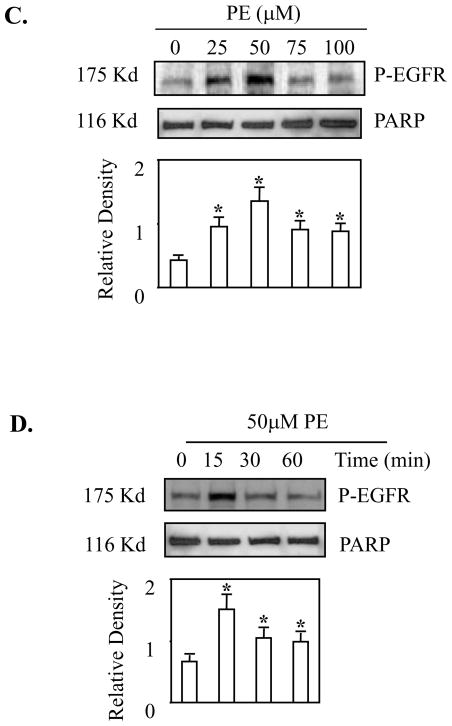
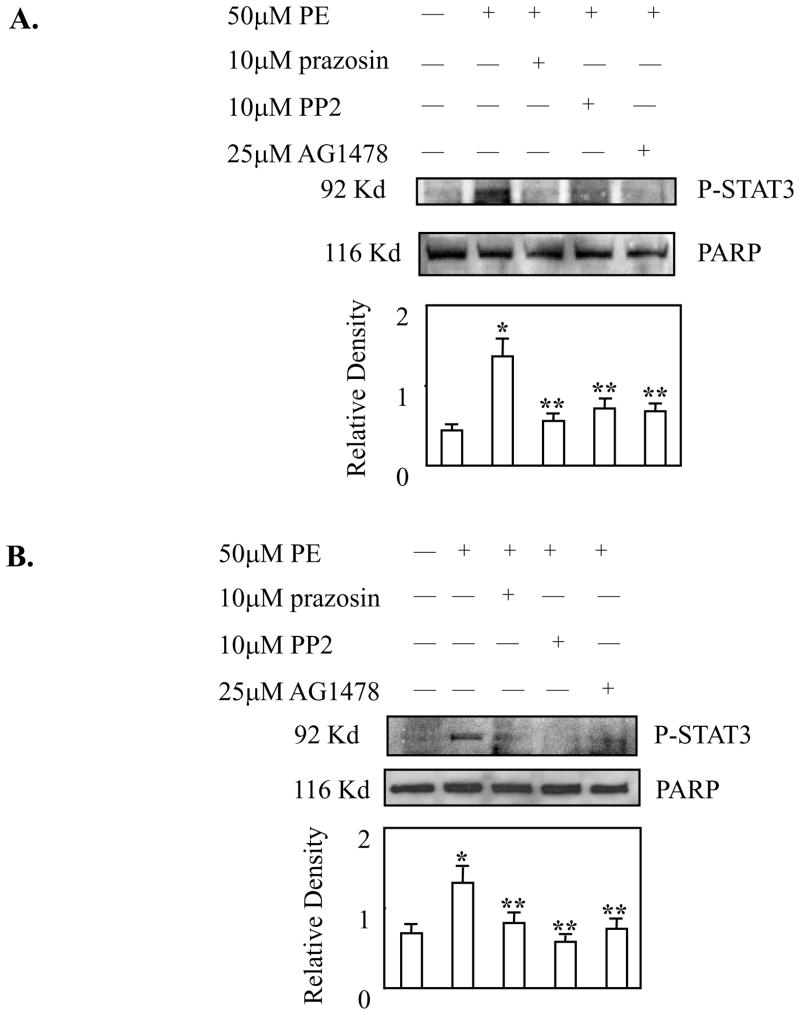
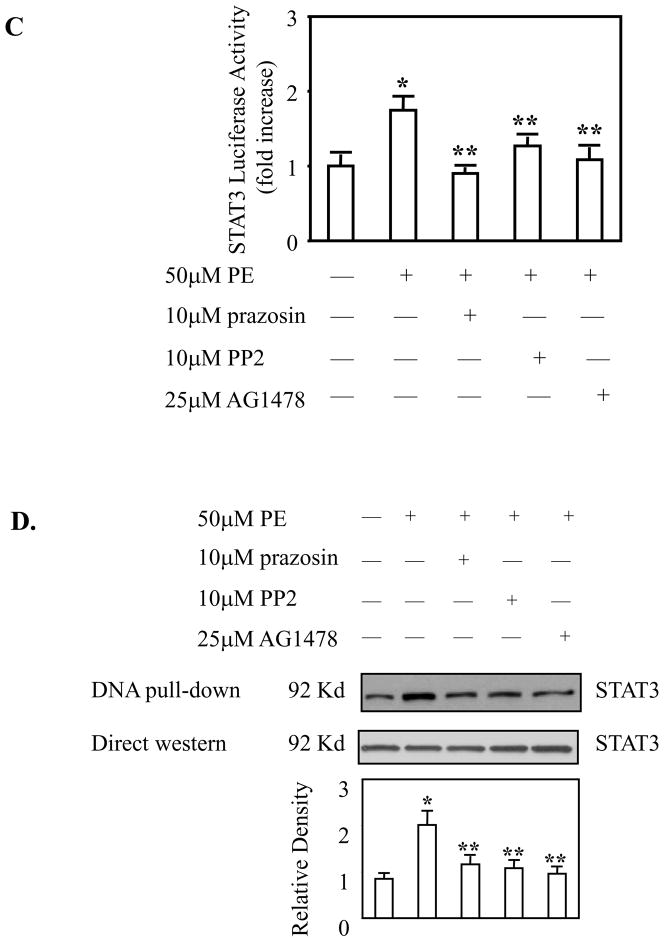
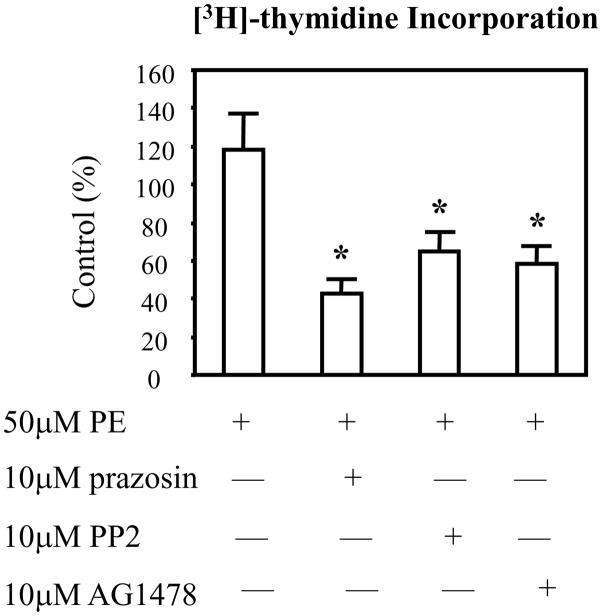
Hepatocytes express adrenergic receptors (ARs) that modulate several functions, including liver regeneration, hepatocyte proliferation, glycogenolysis, gluconeogenesis, synthesis of urea and fatty acid metabolism. Adrenergic hepatic function in adults is mainly under the control of alpha(1)-ARs; however, the mechanism through which they influence diverse processes remains incompletely understood. This study describes a novel alpha(1)-AR-mediated transactivation of signal transducer and activator of transcription-3 (Stat3) in primary and transformed hepatocytes. Treatment of primary rat hepatocytes with the alpha(1)-AR agonist, phenylephrine (PE), induced a rapid phosphorylation of Stat3. PE also increased Stat3 phosphorylation, DNA binding and transcription activity in transformed human hepatocellular carcinoma cells (Hep3B). The PE-induced Stat3 phosphorylation, DNA binding and reporter activity were completely blocked by the selective alpha(1)-AR antagonist, prazosin. In addition, transfection of Hep3B cells with human alpha(1B)-AR expression vector also enhanced Stat3 phosphorylation and reporter activity. Moreover, overexpression of RGS2, a protein inhibitor of G(q/11) signaling, blocked PE-induced Stat3 phosphorylation and reporter activity. The observations that PE induced the formation of c-Src-Stat3 binding complex and phosphorylation of epidermal growth factor receptor (EGFR) and that inhibiting Src and EGFR prevented PE-induced Stat3 activation indicate the involvement of Src and EGFR. Taken together, these observations demonstrate a novel alpha(1)-AR-mediated Stat3 activation that involves G(q/11), Src, and EGFR in hepatic cells.


Figures

Figure 1
Figure 1. Phenylephrine, a selective α1-AR agonist, induces the phosphorylation of Stat3 in hepatocytes. This effect is blocked by prazosin, a selective α1-AR antagonist
A. Dose-dependent effect of PE on Stat3 phosphorylation in primary hepatocytes. Rat primary hepatocytes were treated with different doses of PE for 15 minutes. The cells were then harvested to obtain nuclear proteins. The obtained samples were subjected to SDS-PAGE and Western blotting to detect Stat3 phosphorylation as described in the Experimental Procedures. PARP level was determined by reprobing the same blot with anti-PARP antibody. Quantitative analysis of Stat3 phosphorylation was performed by determining the ratio between Stat3 phosphorylation and PARP protein levels from three different experiments with densitometry (*p<0.01 compared with control cells). B. Time-course effect of PE on Stat3 phosphorylation in primary hepatocytes. Rat primary hepatocytes were treated with 50μM PE for different times. The cells were then harvested to isolate nuclear proteins. The obtained samples were subjected to SDS-PAGE and Western blot to detect Stat3 phosphorylation and PARP level. Quantitative analysis of Stat3 phosphorylation was performed by determining the ratio between Stat3 phosphorylation and PARP protein levels from three different experiments with densitometry (*p<0.01 compared with control cells). C. Dose-dependent effect of PE on Stat3 phosphorylation in Hep3B cells. Hep3B cells were treated with different doses of PE for 15 minutes. The cells were then harvested to isolate nuclear proteins. The obtained samples were subjected to SDS-PAGE and Western blot to detect Stat3 phosphorylation and PARP level. Quantitative analysis of Stat3 phosphorylation was performed by determining the ratio between Stat3 phosphorylation and PARP protein levels from three different experiments with densitometry (*p<0.05 compared with control cells). D. Time-course effect of PE on Stat3 phosphorylation in Hep3B cells. Hep3B cells were treated with 50μM PE for different times. The cells were then harvested to isolate nuclear proteins. The samples were subjected to SDS-PAGE and Western blot to detect Stat3 phosphorylation and PARP level. Quantitative analysis of Stat3 phosphorylation was performed by determining the ratio between Stat3 phosphorylation and PARP protein levels from three different experiments with densitometry (*p<0.05 compared with control cells). E. Prazosin blocks PE-induced Stat3 phosphorylation in primary hepatocytes. Rat primary hepatocytes were treated with 50μM PE for 15 minutes with or without prazosin pretreatment (10μM, 30 minutes). The cells were then harvested to isolate nuclear proteins. The obtained samples were subjected to SDS-PAGE and Western blot to detect Stat3 phosphorylation and PARP level. Quantitative analysis of Stat3 phosphorylation was performed by determining the ratio between Stat3 phosphorylation and PARP protein levels from three different experiments with densitometry (*p<0.01 compared with control cells; **p<0.01 compared with PE treatment). F. Prazosin blocks PE-induced Stat3 phosphorylation in Hep3B cells. Hep3B cells were treated with 50μM PE for 15 minutes with or without prazosin pretreatment (10μM, 30 minutes). The cells were then harvested to isolate nuclear proteins. The samples were subjected to SDS-PAGE and western blot to detect Stat3 phosphorylation and PARP level. Quantitative analysis of Stat3 phosphorylation was performed by determining the ratio between Stat3 phosphorylation and PARP protein levels from three different experiments with densitometry (*p<0.05 compared with control cells; **p<0.05 compared with PE treatment).
Figure 2
Figure 2. The effect of phenylephrine versus IL-6 on Stat3 phosphorylation
A. The effect of phenylephrine versus IL-6 on Stat3 phosphorylation in rat primary hepatocytes. Rat primary hepatocytes were treated with either 10 ng/ml IL-6 or 50 μM PE and vehicle as control for 15 minutes and then isolated either nuclear proteins to determine Stat3 phosphorylation (top panel) or cellular proteins to determine Stat3 protein level (middle panel) by immunoblotting (*p<0.01 compared with control cells). B. The effect of phenylephrine versus IL-6 on Stat3 phosphorylation in Hep 3B cells. The serum-starved Hep 3B cells were treated with either 10 ng/ml IL-6 or 50 μM PE and vehicle as control for 15 minutes and then isolated either nuclear proteins to determine Stat3 phosphorylation (top panel) or cellular proteins to determine Stat3 protein level (middle panel) by immunoblotting (*p<0.01 compared with control cells).
Figure 3
Figure 3. Phenylephrine increases Stat3 DNA binding and transcription activity; the effect is blocked by prazosin
A. PE increases the binding of Stat3 to its DNA response element; the effect is blocked by prazosin. Hep3B cells were treated with vehicle or 50μM PE for 15 minutes with or without prazosin pre-treatment (10μM prazosin for 30 minutes). The cells were harvested to isolate cellular proteins. The samples were precipitated with the biotinylated oligonucleotides (containing Stat3 binding site) followed by immunoblotting with anti-Stat3 antibody (top panel). Equal amounts of the cell lysates were used to detect Stat3 by direct western blot (mid panel). Quantitative analysis of Stat3 binding ability to its response element was performed by determining the ratio between bound and input Stat3 levels with densitometry (bottom panel) (*p<0.01 compared with control cells; **p<0.05 compared with PE treatment). B. PE increases Stat3 transcription activity; the effect is blocked by prazosin. Hep3B cells with eighty percent confluence were transiently transfected with pStat3-Luc reporter vector. After transfection the cells were treated with vehicle as control, or 50μM PE in the absence or presence of 10μM prazosin overnight. The cell lysates were obtained to determine the luciferase activity as described in the Experimental Procedures. The relative luciferase activity was normalized to cellular proteins. The data are presented as mean ± S.D. of six independent experiments. PE significantly increased Stat3 luciferase reporter activity when compared with control (*p<0.01). The PE-induced Stat3 luciferase reporter activity is blocked by prazosin (**p<0.05).
Figure 4
Figure 4. Overexpression of α1B-adrenergic receptor, but not β2-adrenergic receptor, increases Stat3 phosphorylation
A. Overexpression of α1B-AR increases Stat3 transcription activity. Hep3B cells with eighty percent confluence were transiently co-transfected with the α1B-AR expression plasmid or pcDNA control plasmid together with pStat3-Luciferase vector and pSV--galactosidase. After transfection the cells were cultured in the absence or presence of 50 μM PE in serum-free medium overnight. The cell lysates were then obtained to determine the luciferase activity as described in the Experimental Procedures. The relative luciferase activity was normalized to β-galactosidase activity. The data are presented as mean ± S.D. of six independent experiments (*p<0.05 compared with control vector cells without PE treatment; **p<0.01 compared with control vector cells without PE treatment; ***p<0.01 compared with control vector cells plus PE treatment). B. Overexpression of β2-AR increases CRE reporter activity. Hep3B cells with eighty percent confluence were transiently transfected with the β2-AR expression plasmid or pcDNA control plasmid with co-transfection of pCRE-Luc reporter vector. After transfection the cells were treated with vehicle as control, or 100μM isoproterenol (Iso) in serum-free medium overnight. The cell lysates were obtained to determine the luciferase activity as described in the Experimental Procedures. The relative luciferase activity was normalized to cellular proteins. The data are presented as mean ± S.D. of six independent experiments. Isoproterenol significantly increased CRE-luciferase reporter activity in β2-AR overexpressed cells when compared with control vector cells (* p<0.01). C. Overexpression of β2-AR has no effect on Stat3 transcription activity. Hep3B cells with eighty percent confluence were transiently transfected with the β2-AR expression plasmid or pcDNA control plasmid with co-transfection of pStat3-Luc reporter vector. After transfection the cells were treated with vehicle as control, or 100μM isoproterenol (Iso) in serum-free medium overnight and the cell lysates were obtained to determine the luciferase activity. The relative luciferase activity was normalized to cellular proteins. The data are presented as mean ± S.D. of six independent experiments. A similar level of Stat3 reporter activity was observed in β2-AR overexpressed cells and control vector cells, with or without isoproterenol treatment. D. Overexpression of α1B-AR increases Stat3 phosphorylation. Hep 3B cells with eighty percent confluence were transiently transfected with the α1B-AR expression plasmid or pcDNA control plasmid. After transfection the cells were cultured in serum-free medium for 24 hours. The cells were then harvested and nuclear proteins were obtained to determine Stat3 phosphorylation (top panel) and PARP level (mid panel) by immunoblotting. Quantitative analysis of Stat3 phosphorylation was performed by determining the ratio between Stat3 phosphorylation and PARP protein levels from three different experiments with densitometry (bottom panel; *p<0.05 compared with control vector cells).
Figure 5
Figure 5. RGS2 overexpression blocks PE-induced Stat3 phosphorylation and transcription activity
A. RGS2 overexpression blocks PE-induced Stat3 phosphorylation. Hep3B cells with eighty percent confluence were transiently transfected with either the pcDNA control plasmid or RGS2 expression plasmid. After transfection the cells were cultured in serum-free medium overnight and then treated with either vehicle or 50μM PE for 15 minutes. The cells were harvested and nuclear proteins were obtained to determine the phosphorylation of Stat3 (top panel) and the level of PARP (mid panel) by immunoblotting. Quantitative analysis of Stat3 phosphorylation was performed by determining the ratio between the Stat3 phosphorylation and PARP protein levels from three different experiments with densitometry (bottom panel; *p<0.05 compared with control vector cells without PE treatment; **p<0.05 compared with control vector cells withphenylephrine t reatment). B. RGS2 overexpression blocks PE-induced Stat3 transcription activity. Hep3B cells with eighty percent confluence were transiently transfected with pcDNA control plasmid or the RGS2 expression plasmid with co-transfection of pStat3-Luc reporter vector. After transfection the cells were cultured in the absence or presence of 50μM PE in serum-free medium overnight. The cell lysates were then obtained to determine the luciferase reporter activity as described in the Experimental Procedures. The relative luciferase activity was normalized to cellular proteins. The data are presented as mean ± S.D. of six independent experiments (*p<0.01 compared with phenylephrine treatment of control vector cells). C. RGS2 overexpression has no effect on isoproterenol-induced CRE reporter activity. Hep3B cells with eighty percent confluence were transiently co-transfected with pcDNA control plasmid or the RGS2 expression plasmid together with β2-AR expression plasmid and pCRE-Luc reporter vector. After transfection the cells were treated overnight with vehicle as control or 100μM isoproterenol (Iso) in serum-free medium. The cell lysates were then obtained to determine the luciferase reporter activity. The relative luciferase activity was normalized to cellular proteins. The data are presented as mean ± S.D. of six independent experiments. D. Pertussis toxin has no effect on PE-induced Stat3 transcription activity. Hep3B cells with eighty percent confluence were transiently transfected with pStat3-Luc reporter vector. After transfection the cells were cultured with vehicle as control or 50μM PE in the absence or presence of 10μM prazosin or 200 ng/ml pertussis toxin (PTX) in serum-free medium overnight. The cell lysates were then obtained to determine the luciferase reporter activity. The relative luciferase activity was normalized to cellular proteins. The data are presented as mean ± S.D. of six independent experiments. The Stat3 luciferase reporter activity induced by PE is blocked by prazosin (*p<0.01 compared with PE treatment alone), but not by pertussis toxin.
Figure 6
Figure 6. PE increases the binding of c-Src to Stat3 and the effect is blocked by prazosin
Hep3B cells were treated with 50μM PE for 15 minutes with or without prazosin pretreatment (10μM for 30 minutes). The cells were harvested and cellular proteins were obtained for immunoprecipitation with anti-c-Src antibody and subsequent immunobloting with anti-Stat3 antibody. The precipitated Stat3 (92 kDa) is shown in the top panel. For negative control, the cellular proteins from PE-treated cells were immunoprecipitated with IgG. Equal amounts of the same cell lysates were used for regular western blot to detect the protein levels of Stat3 (mid panel) and c-Src (bottom panel). Quantitative analysis of bound Stat3 was performed by determining the ratio between immunoprecipitated and input Stat3 levels with densitometry (*p<0.01 compared with vehicle treatment; **p<0.05 compared with PE treatment).
Figure 7
Figure 7. PE induced the phosphorylation of EGFR in hepatocytes
A. Dose-dependent effect of PE on EGFR phosphorylation in primary hepatocytes. Rat primary hepatocytes were treated with increasing concentrations of PE for 15 minutes. The cells were harvested and nuclear proteins were obtained. EGFR phosphorylation was determined by immunoblotting as described in the Experimental Procedures. PARP was determined by reprobing the same blot with anti-PARP antibody. Quantitative analysis of EGFR phosphorylation was performed by determining the ratio between EGFR phosphorylation and PARP protein levels from three different experiments with densitometry (*p<0.01 compared with control cells). B. Time-course of PE on EGFR phosphorylation in primary hepatocytes. Rat primary hepatocytes were treated with 50μM PE for different times. The cells were harvested to obtain nuclear proteins. EGFR phosphorylation and PARP level were determined by immunoblotting. PE-induced EGFR phosphorylation was observed within 15 minutes after treatment. Quantitative analysis of EGFR phosphorylation was performed by determining the ratio between EGFR phosphorylation and PARP protein levels from three different experiments with densitometry (*p<0.01 compared with control cells). C. Dose-dependent effect of PE on EGFR phosphorylation in Hep3B cells. The cells were treated with different doses of PE for 15 minutes. The treated cells were harvested to obtain nuclear proteins. EGFR phosphorylation was determined by immunoblotting with anti-phospho-EGFR antibody. PARP was determined by reprobing the same blot with anti-PARP antibody. Quantitative analysis of EGFR phosphorylation was performed by determining the ratio between EGFR phosphorylation and PARP protein levels from three different experiments with densitometry (*p<0.05 compared with control cells). D. Time-course effect of PE on EGFR phosphorylation in Hep3B cells. The cells were treated with 50μM PE for different times. The treated cells were harvested to obtain nuclear proteins. EGFR phosphorylation was determined by immunoblotting with anti-phospho-EGFR antibody. PARP was determined by reprobing the same blot with anti-PARP antibody. PE-induced EGFR phosphorylation was observed within 15 minutes after treatment. Quantitative analysis of EGFR phosphorylation was performed by determining the ratio between EGFR phosphorylation and PARP protein levels from three different experiments with densitometry (*p<0.05 compared with control cells).
Figure 8
Figure 8. The phenylephrine-induced Stat3 phosphorylation, DNA binding and transcription activity are inhibited by the Src inhibitor, PP2, and the EGFR kinase inhibitor, AG1478
A. PP2 and AG1478 block PE-induced Stat3 phosphorylation in primary hepatocytes. Rat primary hepatocytes were treated with 50μM PE for 15 minutes with or without 30 minute pretreatment of prazosin (10μM), PP2 (10μM), or AG1478 (25μM). The cells were harvested to obtain nuclear proteins. Stat3 phosphorylation and PARP level were determined by immunoblotting. Quantitative analysis of Stat3 phosphorylation was performed by determining the ratio between Stat3 phosphorylation and PARP protein levels from three different experiments with densitometry (*p<0.01 compared with control cells; **p<0.01 compared with PE treatment). B. PP2 and AG1478 block PE-induced Stat3 phosphorylation in Hep3B cells. The cells were treated with 50μM PE for 15 minutes with or without 30 minute pretreatment of prazosin (10μM), PP2 (10μM), or AG1478 (25μM). The cells were harvested to obtain nuclear proteins. Stat3 phosphorylation and PARP level were determined by immunoblotting. Quantitative analysis of Stat3 phosphorylation was performed by determining the ratio between Stat3 phosphorylation and PARP protein levels from three different experiments with densitometry (*p<0.01 compared with control cells; **p<0.01 compared with PE treatment). C. PP2 and AG1478 block PE-induced Stat3 transcription activity in Hep3B cells. The cells with eighty percent confluence were transiently transfected with pStat3-Luc reporter vector. After transfection the cells were treated with vehicle as control or 50μM PE in the absence or presence of 10μM prazosin, 10μM PP2 or 25μM AG1478 overnight. The cell lysates were obtained to determine the luciferase reporter activity. The relative luciferase activity was normalized to cellular proteins. The data are presented as mean ± S.D. of six independent experiments (*p<0.01 compared with control; **p<0.05 compared with PE treatment). D. PP2 and AG1478 block PE-induced Stat3 binding to its response element in Hep3B cells. The cells were treated with 50μM PE for 15 minutes with or without 30 minute pretreatment of prazosin (10μM), PP2 (10μM), or AG1478 (25μM). The cells were harvested to obtain cellular proteins. The samples were then precipitated with biotinylated oligonucleotides containing Stat3 binding site followed by immunoblotting with anti-Stat3 antibody (top panel). Equal amounts of the cell lysates were used to detect Stat3 by direct western blot (mid panel). Quantitative analysis of Stat3 binding ability to its response element was performed by determining the ratio between bound and input Stat3 levels with densitometry (bottom panel) (*p<0.01 compared with control cells; **p<0.05 compared with PE treatment).
Figure 9
Figure 9. Rat hepatocyte DNA synthesis was inhibited by prazosin, PP2 and AG1478
Following isolation of rat primary hepatocytes, the cells were incubated and checked for adherence of monolayers after 2 to 4 hours. Once adhered, the cells were subjected to treatment with 10μM phenylephrine without or with 10μM prazosin, 10μM PP2, or 10 μM AG1478 together with the addition of [3H]thymidine. The cells were subsequently cultured for overnight. [3H]thymidine incorporation into DNA was determined by liquid scintillation and the values are relative to control. The results are expressed as mean ± S.D of three experiments. The cells treated with prazosin, or PP2 or AG1478 showed significantly decreased DNA synthesis when compared with vehicle or PE treated cells(* p<0.01).

Similar articles

Cited by

References

    1. Allen LF, Lefkowitz RJ, Caron MG, Cotecchia S. G-protein-coupled receptor genes as protooncogenes: constitutively activating mutation of the alpha 1B-adrenergic receptor enhances mitogenesis and tumorigenicity. Proc Natl Acad Sci U S A. 1991;88(24):11354–11358. - PMC - PubMed
    1. Bertelsen LS, Barrett KE, Keely SJ. Gs protein-coupled receptor agonists induce transactivation of the epidermal growth factor receptor in T84 cells: implications for epithelial secretory responses. J Biol Chem. 2004;279(8):6271–6279. - PubMed
    1. Boccaccio C, Ando M, Tamagnone L, Bardelli A, Michieli P, Battistini C, Comoglio PM. Induction of epithelial tubules by growth factor HGF depends on the STAT pathway. Nature. 1998;391(6664):285–288. - PubMed
    1. Boluyt MO, Zheng JS, Younes A, Long X, O’Neill L, Silverman H, Lakatta EG, Crow MT. Rapamycin inhibits alpha 1-adrenergic receptor-stimulated cardiac myocyte hypertrophy but not activation of hypertrophy-associated genes. Evidence for involvement of p70 S6 kinase. Circ Res. 1997;81(2):176–186. - PubMed
    1. Bromberg JF, Wrzeszczynska MH, Devgan G, Zhao Y, Pestell RG, Albanese C, Darnell JE., Jr Stat3 as an oncogene. Cell. 1999;98(3):295–303. - PubMed

Publication types

MeSH terms