. 2008 May 10;508(2):264-85.
doi: 10.1002/cne.21671.

Synaptic organization of thalamocortical axon collaterals in the perigeniculate nucleus and dorsal lateral geniculate nucleus

Affiliations

Synaptic organization of thalamocortical axon collaterals in the perigeniculate nucleus and dorsal lateral geniculate nucleus

Martha E Bickford et al. J Comp Neurol. .

Abstract

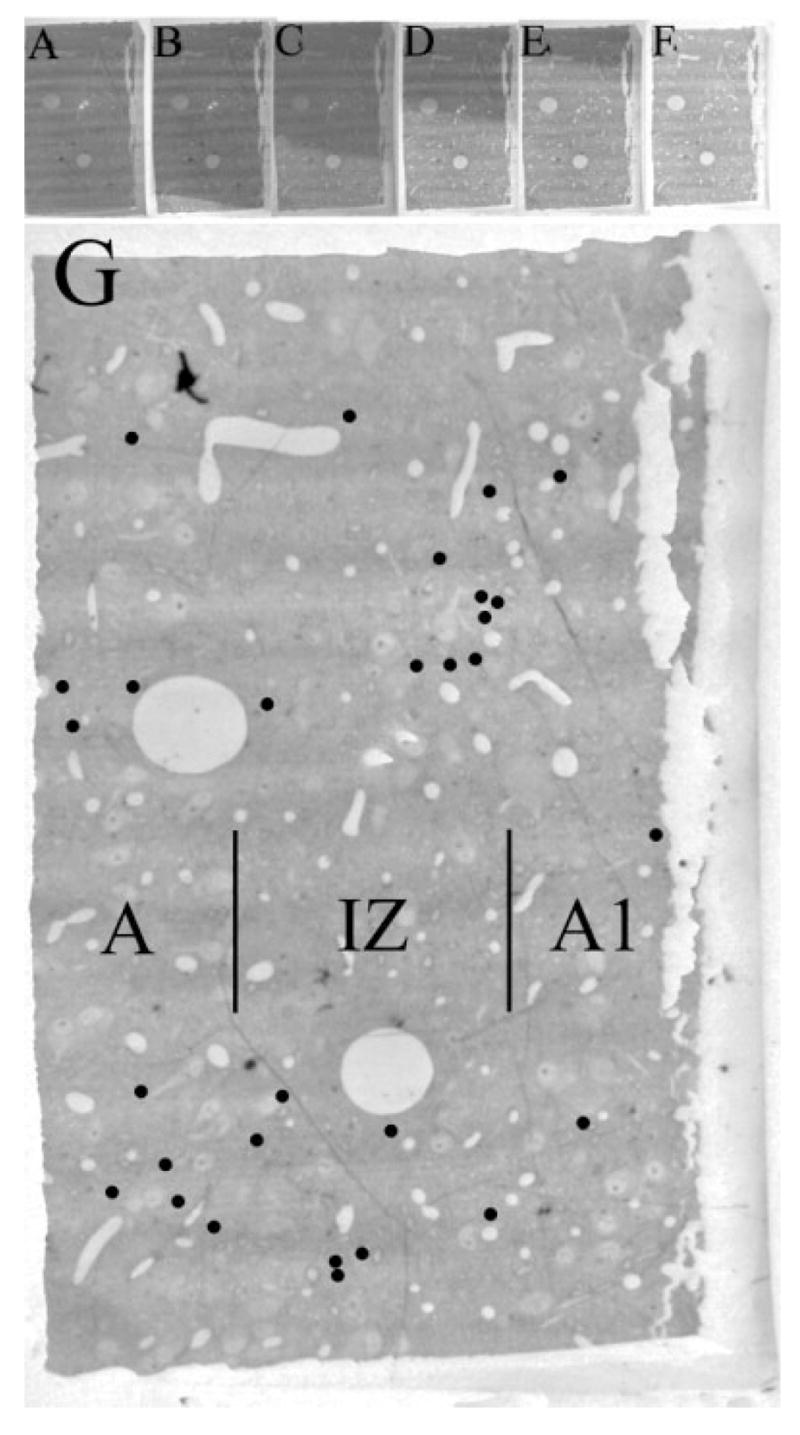
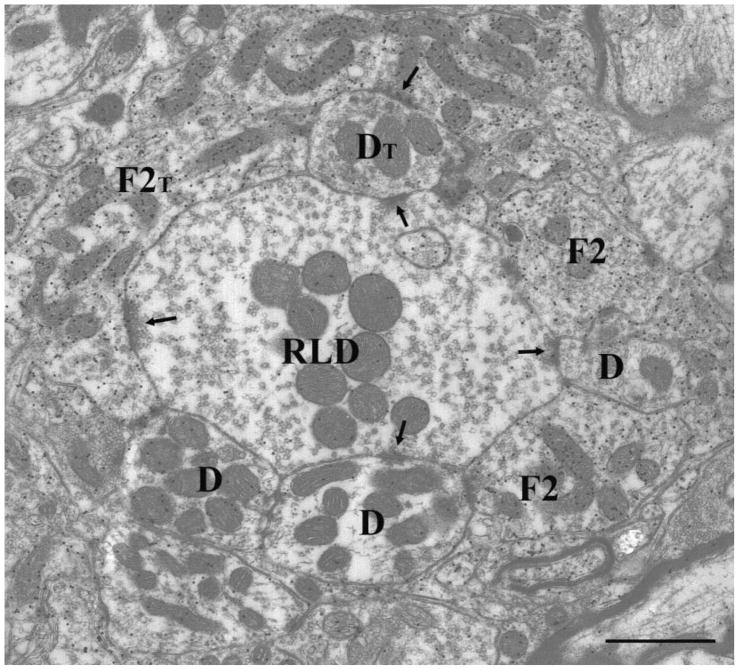
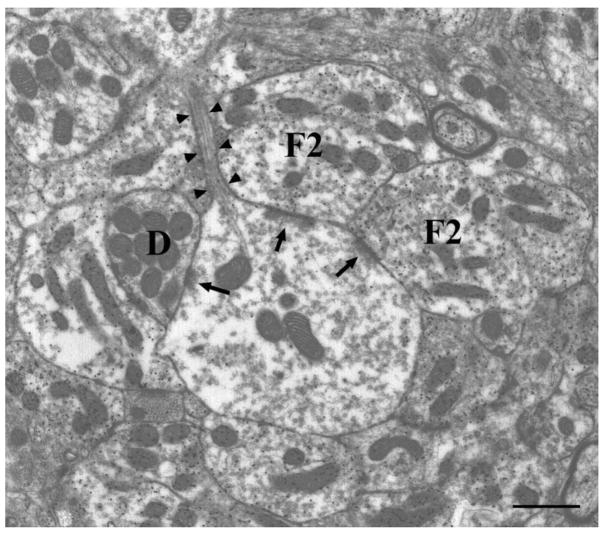
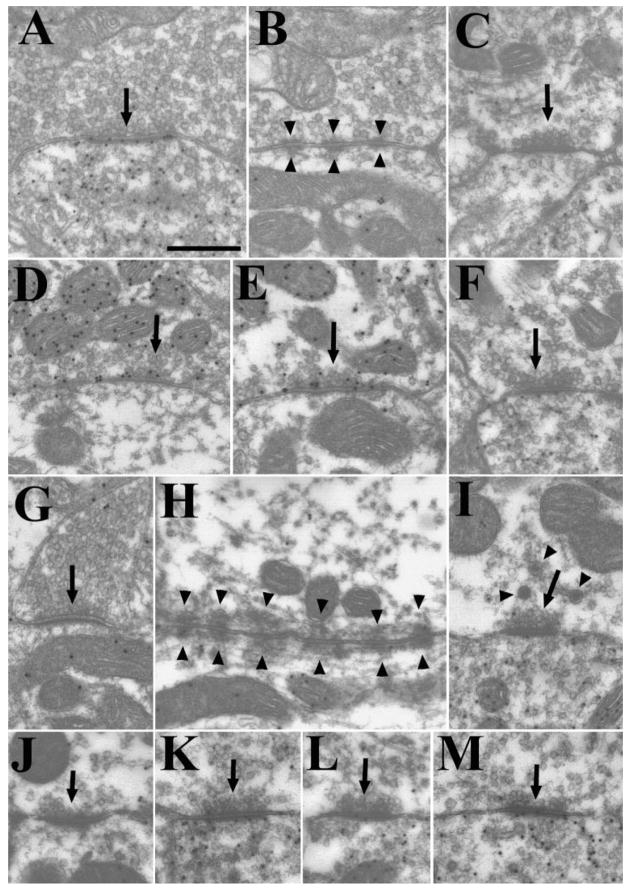
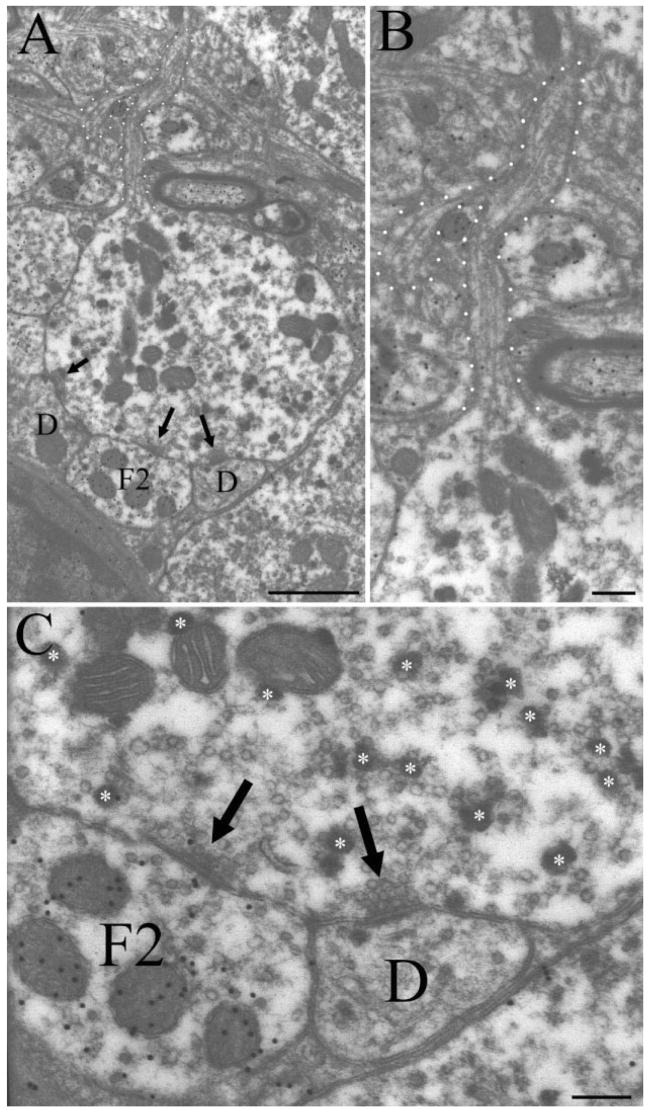
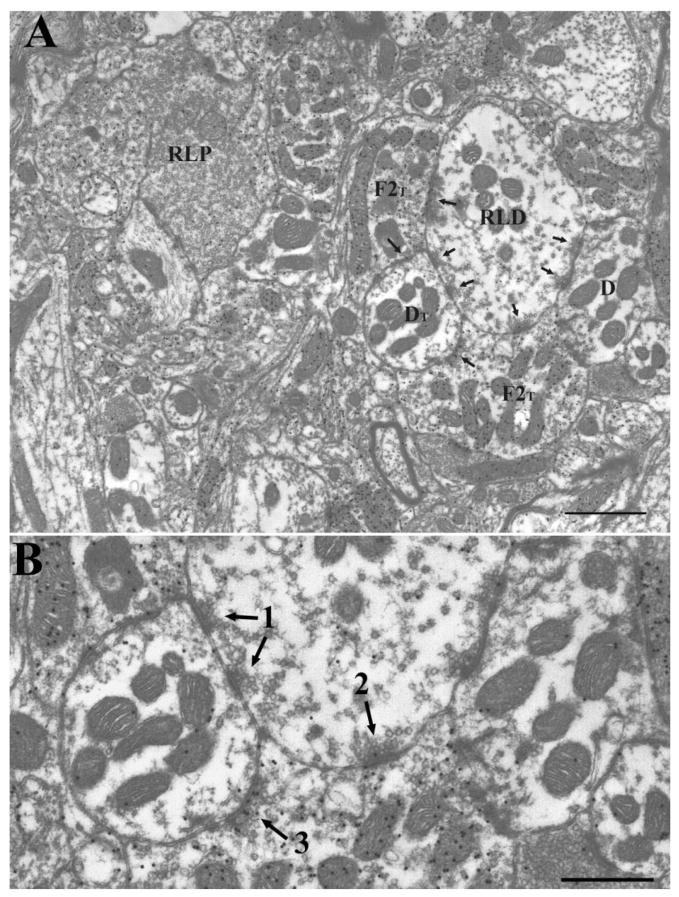
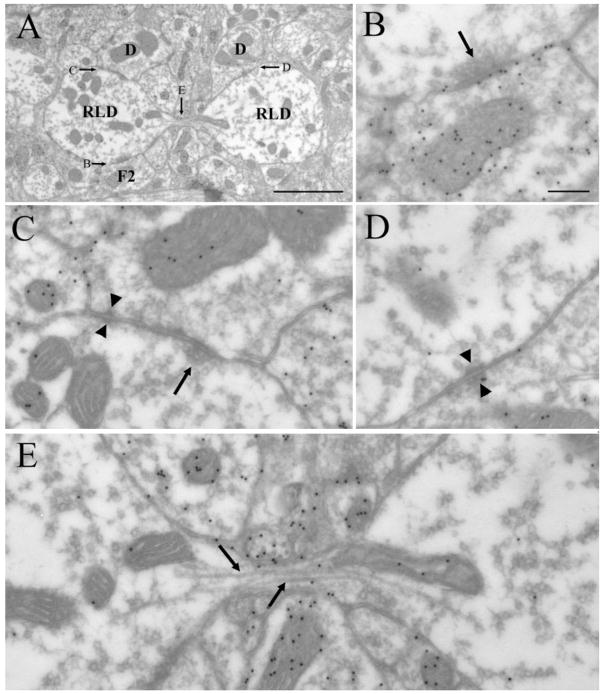
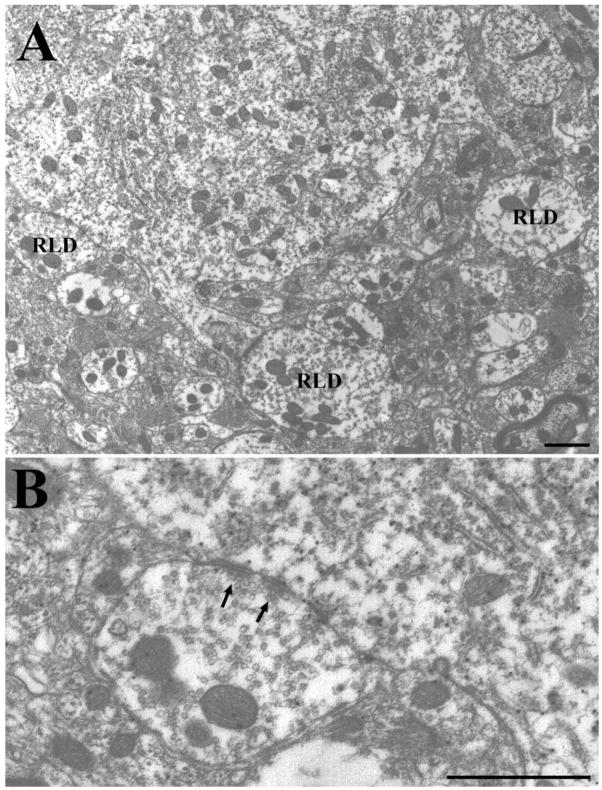
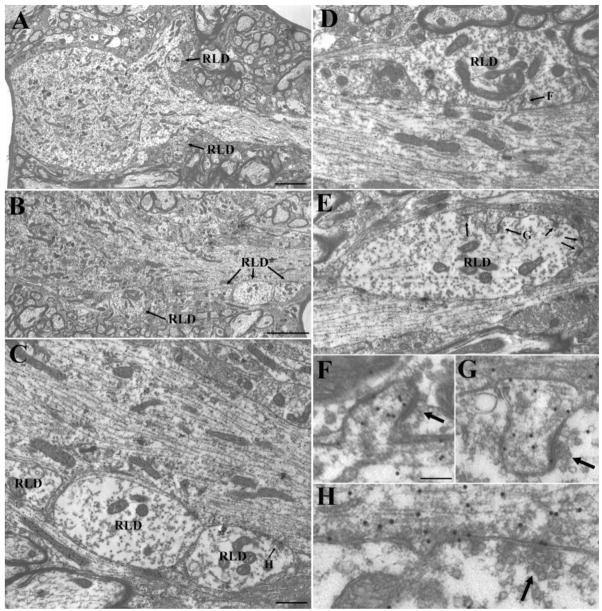
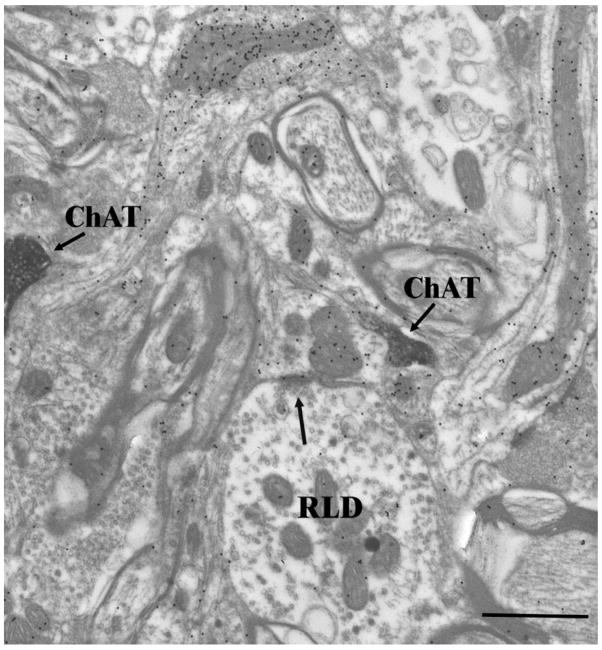
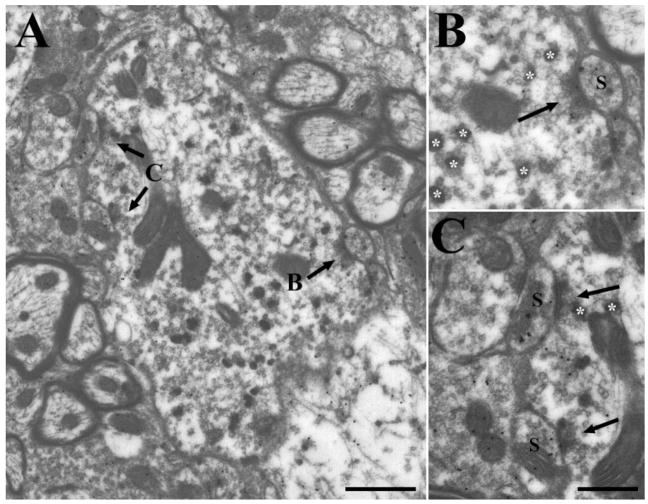
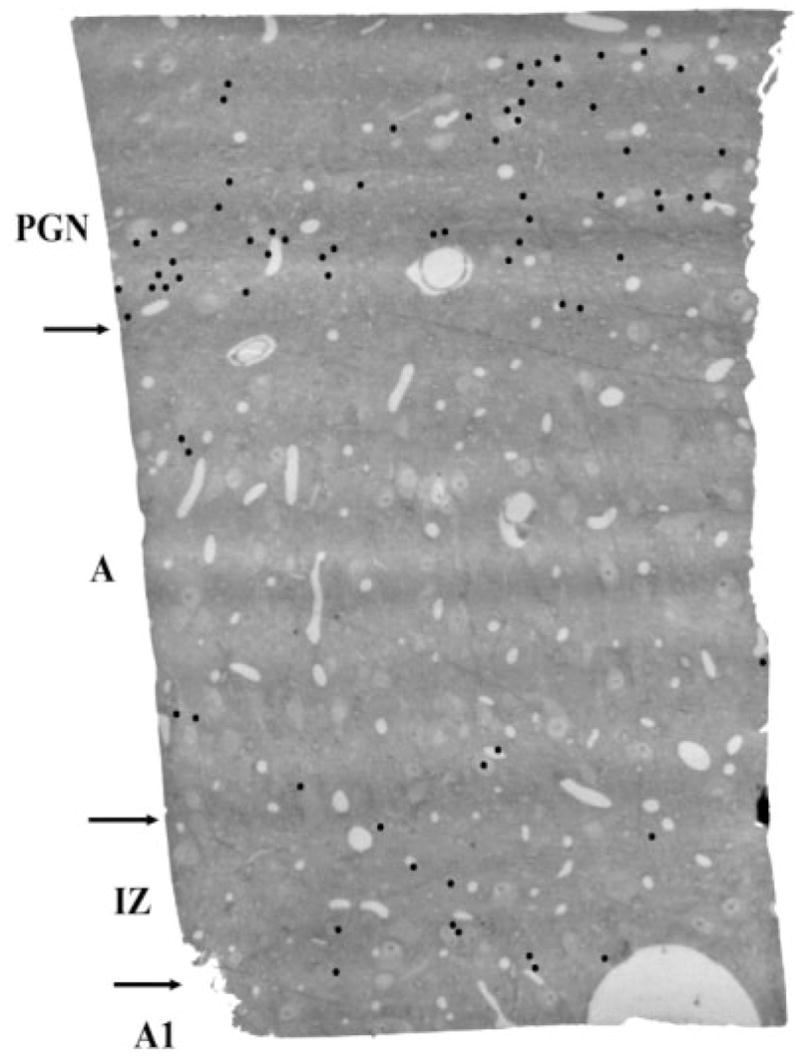
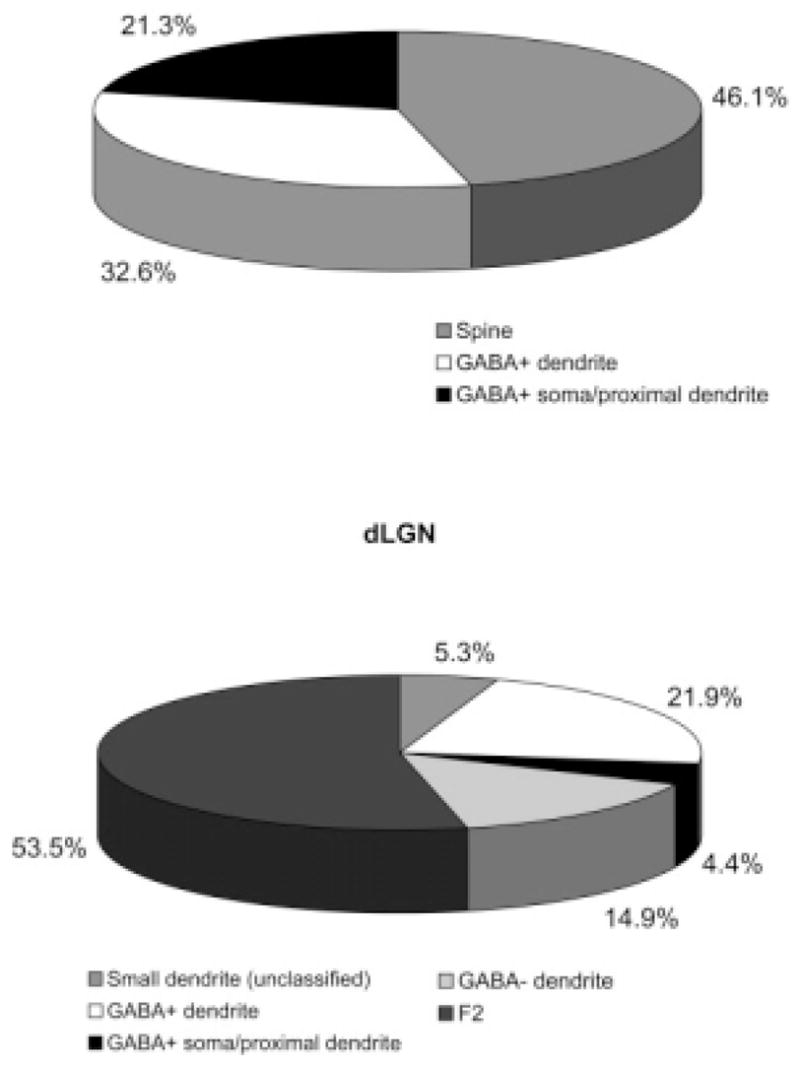
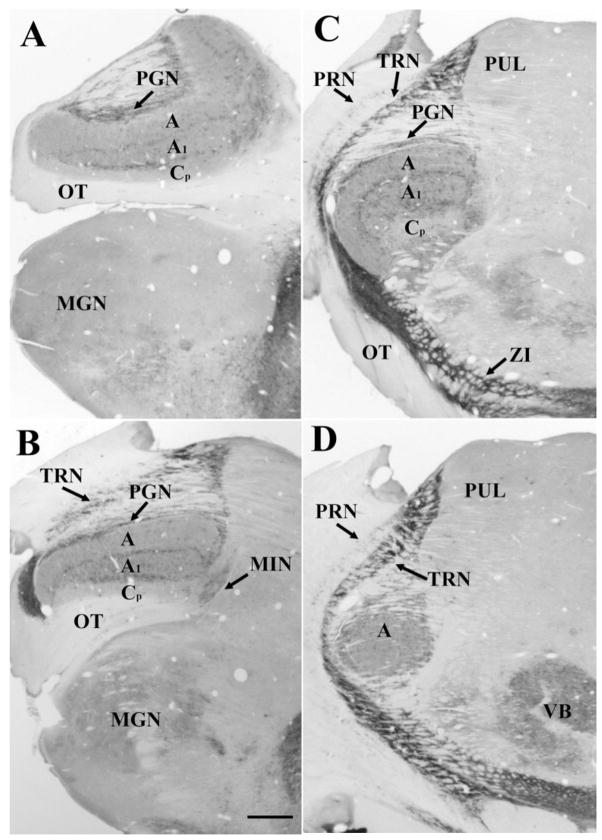
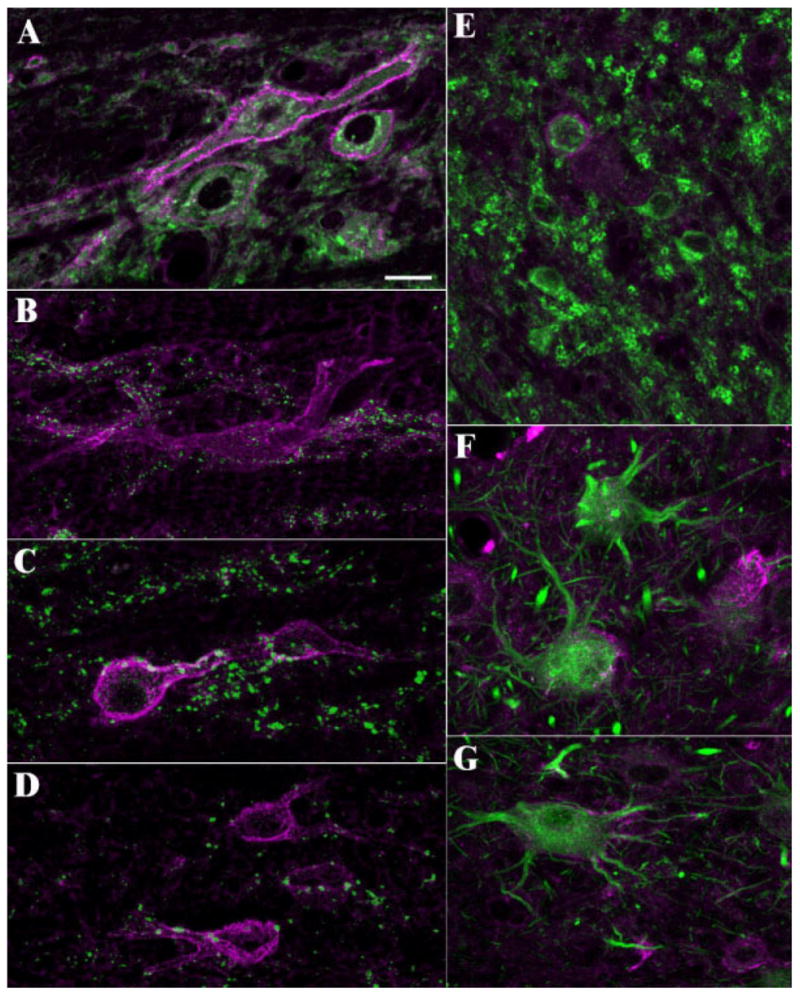
We examined the synaptic targets of large non-gamma-aminobutyric acid (GABA)-ergic profiles that contain round vesicles and dark mitochondria (RLD profiles) in the perigeniculate nucleus (PGN) and the dorsal lateral geniculate nucleus (dLGN). RLD profiles can provisionally be identified as the collaterals of thalamocortical axons, because their ultrastrucure is distinct from all other previously described dLGN inputs. We also found that RLD profiles are larger than cholinergic terminals and contain the type 2 vesicular glutamate transporter. RLD profiles are distributed throughout the PGN and are concentrated within the interlaminar zones (IZs) of the dLGN, regions distinguished by dense binding of Wisteria floribunda agglutinin (WFA). To determine the synaptic targets of thalamocortical axon collaterals, we examined RLD profiles in the PGN and dLGN in tissue stained for GABA. For the PGN, we found that all RLD profiles make synaptic contacts with GABAergic PGN somata, dendrites, and spines. In the dLGN, RLD profiles primarily synapse with GABAergic dendrites that contain vesicles (F2 profiles) and non-GABAergic dendrites in glomerular arrangements that include triads. Occasional synapses on GABAergic somata and proximal dendrites were also observed in the dLGN. These results suggest that correlated dLGN activity may be enhanced via direct synaptic contacts between thalamocortical cells, whereas noncorrelated activity (such as that occurring during binocular rivalry) could be suppressed via thalamocortical collateral input to PGN cells and dLGN interneurons.


Figures

Fig. 1
Fig. 1
A–G: To determine the distribution of RLD profiles, the entire section was scanned at a magnification of ×3,400 while viewing the section through the binoculars of the electron microscope. When an RLD was encountered, its identity was verified at ×8,700, and the location was noted by examining blood vessel and cell patterns at low magnification. This was facilitated by the lightening of section areas that had been previously scanned. The image in A was taken before the section was scanned. The images in B–F were taken as the section was progressively scanned. The distribution of RLD profiles within the section (G, black dots) is plotted on a low-magnification image of the 300-μm × 530-μm section. Each RLD observed is indicated by a single dot, regardless of whether it was involved in a synapse. Lines indicate the approximate borders of the A and A1 laminae and the interlaminar zone (IZ) as determined by examining the flat-embedded 50-μm-thick section prior to thin sectioning.
Fig. 2
Fig. 2
In the dLGN, RLD profiles form synaptic contacts (arrows) with GABAergic dendritic terminals (F2 profiles, high density of gold particles) and non-GABAergic thalamocortical cell dendrites (D, low density of gold particles), often in triadic arrangements (F2T and DT). The profile shown was located in the dorsal region of lamina A (just ventral to the PGN). Scale bar = 1 μm.
Fig. 3
Fig. 3
In some sections, RLD profiles are seen to emerge from small unmyelinated processes (arrowheads) that contain microtubules and vesicles. The illustrated RLD profile forms synaptic contacts (arrows) with two GABAergic dendritic terminals (F2 profiles, high density of gold particles) and one non-GABAergic thalamocortical cell dendrites (D, low density of gold particles). The RLD profile was located in the A/A1 interlaminar zone. Scale bar = 1 μm.
Fig. 4
Fig. 4
RLD synapses are distinct from all other identified contacts observed in the dLGN. A: Synaptic contact (arrow) formed by a large profile with round vesicles and pale mitochondria (RLP profile) onto a GABAergic dendritic terminal (F2 profile). B: Puncta adherentia (arrowheads) formed between an RLP profile and a non-GABAergic dendrite. D: Synaptic contact (arrow) formed by a GABAergic axon terminal (F1 profile) on a nonGABAergic dendrite. E: Synaptic contact (arrow) formed by an F2 profile on a nonGABAergic dendrite. G: Synaptic contact (arrow) formed by a small profile with round vesicles (RSD profile) on a non-GABAergic dendrite. H: Puncta adherentia (arrowheads) formed between two non-GABAergic dendrites. C,F,I–M: Synaptic contacts (arrows) formed by RLD profiles on non-GABAergic dendrites (C,J) and F2 profiles (F,I,K–M). RLD synaptic contacts are identified by a cluster of vesicles adjacent to a synaptic cleft. The postsynaptic density is slightly thicker than the presynaptic density. Occasional dense-core vesicles are observed in RLD profiles (I, arrowheads). Scale bar = 0.5 μm.
Fig. 5
Fig. 5
A–C: Imunohistochemically, vGLUT2 labels RLD profiles. Shown is an RLD in the A/A1 interlaminar zone labeled with a VIP reaction. The profile synapses on (arrows, shown at higher magnification in C) two thalamocortical cell dendrites (D, low density of gold particles) and an interneuron dendritic terminal (F2, high density of gold particles). The RLD emerges from a small, unmyelinated process that contains microtubules and vesicles (outlined with white dots, shown at higher magnification in B). The VIP reaction forms small, electron-dense granules (indicated by white asterisks in C). Scale bars = 1 μm in A; 0.25 μm in B,C.
Fig. 6
Fig. 6
A: RLD profiles can be easily distinguished from adjacent retinal terminals, identified by their round vesicles, large size, and pale mitochondria (RLP). The RLD profile illustrated was located near the interlaminar zone between lamina A and A1. The RLD profile synapses on (arrows) GABAergic dendritic terminals (F2 profiles, high density of gold particles) and non-GABAergic thalamocortical cell dendrites (D, low density of gold particles). Profiles involved in triadic arrangements are indicated (F2T and DT). B: The three synapses that constitute one of the RLD triadic arrangements are shown at higher magnification. Scale bars = 1 μm in A; 0.5 μm in B.
Fig. 7
Fig. 7
Ultrastructure of two connected RLD profiles in the A/A1 interlaminar zone. Areas shown at higher magnification in B–E are indicated by arrows in A. The left RLD profile synapses (shown at higher magnification in B, arrow) on a GABAergic dendritic terminal (F2 profile, high density of gold particles) and a non-GABAergic thalamocortical cell dendrite (D, low density of gold particles, shown at higher magnification in C, arrow). The RLD profiles are connected via a thin process that contains microtubules (shown at higher magnification in E, arrows). The RLD profiles are also connected to dendrites via puncta adherentia (arrowheads in C,D). Scale bars = 1 μm in A; 0.2 μm in B (applies to B–E).
Fig. 8
Fig. 8
RLD profiles occasionally contact somata in the dLGN. A: Three RLD profiles are associated with a GABAergic (high density of gold particles) cell in the magnocellular lamina C. B: The RLD synaptic contacts (arrows) on the soma in A are illustrated at higher magnification. Scale bars = 1 μm.
Fig. 9
Fig. 9
In the PGN, RLD profiles form synaptic contacts with somata, proximal dendrites, and spines. A,B illustrate the association of RLD profiles with a soma and proximal dendrites. RLDs indicated by the asterisk in B are shown at higher magnification in C. A synaptic contact formed by one of these profiles is illustrated at higher magnification in H (arrow). D,E illustrate RLD synapses with spines. Synaptic contacts are shown at higher magnification in F,G (arrows). The gold particle density overlying the soma and dendrites indicates the presence of GABA detected by postembedding immunocytochemistry. Spines are too small to detect significant levels of GABA but can be seen to arise from GABAergic profiles (D,F). Scale bars = 5 μm in A,B; 1 μm in C (applies to C–E); 0.25 μm in F (applies to F,G); 0.2 μm for H.
Fig. 10
Fig. 10
In PGN tissue stained for choline acetyltransferase (ChAT) with diaminobenzidine, and GABA with gold particles, RLD profiles are unlabeled and larger than ChAT-stained profiles. An RLD synapse on a GABAergic PGN dendrite is indicated with an arrow. Scale bar = 1 μm.
Fig. 11
Fig. 11
A–C: Imunohistochemical labeling of vGLUT2 labels RLD profiles. Shown is an RLD profile in the PGN labeled with a VIP reaction. The profile synapses on (arrows, shown at higher magnification in B and C) three spines (S). The VIP reaction forms small, electron-dense granules (indicated by white asterisks). Scale bars = 1 μm in A; 0.5 μm in C (applies to B,C).
Fig. 12
Fig. 12
Locations of observed RLD profiles (dots) plotted on a low-magnification image of the examined 400-μm × 700-μm thin section that contained the PGN, lamina A, and IZ. The approximate laminar borders are indicated by arrows.
Fig. 13
Fig. 13
The pie charts summarize the synaptic targets of RLD profiles in the PGN and dLGN of case 99-10 (n = 203 synaptic contacts; 89 PGN, 114 dLGN). See text for details.
Fig. 14
Fig. 14
Wisteria floribunda agglutinin (WFA) binding densely labels cells in the perigeniculate nucleus (PGN), and in the dorsal lateral geniculate nucleus (dLGN) is distributed primarily between the A, A1, and parvocellular C (Cp) laminae. Shown are four coronal sections through the dLGN arranged from caudal to rostral (A–D). MGN, medial geniculate nucleus; OT, optic tract; PRN, perireticular nucleus; PUL, pulvinar nucleus; TRN, thalamic reticular nucleus; VB, ventrobasal nucleus; ZI, zona incerta. Scale bar = 1 mm.
Fig. 15
Fig. 15
Confocal images illustrate WFA binding in the PGN (A–D) and dLGN (E–G). A: WFA (purple) outlines PGN cells that contain glutamic acid decarboxylase (GAD, green). A single 1-μm optical section is displayed. B: Terminals stained for the type 1 vesicular glutamate transporter (green) are associated with the dendrites of WFA-stained cells (purple) in the PGN. C,D: Terminals stained for the type 2 vesicular glutamate transporter (green) are associated with the somata and proximal dendrites of WFA-stained cells (purple) in the PGN. E: WFA (purple) binds to some GAD-positive cells in the dLGN (green). The double-labeled cell illustrated is located in lamina A close to the PGN border. F,G: WFA (purple) binds to some putative Y cells identified by SMI-32 staining (green). Shown are cells near the A/A1 interlaminar zone (F) and the magnocellular C lamina (G). Scale bar = 20 μm.

Similar articles

Cited by

References

    1. Abramson BP, Chalupa LM. The laminar distribution of cortical connections with the tecto- and cortico-recipient zones in the cat’s lateral posterior nucleus. Neuroscience. 1985;15:81–95. - PubMed
    1. Acsady L, Kamondi A, Sik A, Freund T, Buzsaki G. GABAergic cells are the major postsynaptic targets of mossy fibers in the rat hippocampus. J Neurosci. 1998;18:3386–3403. - PMC - PubMed
    1. Ahlsén G, Lindström S. Excitation of perigeniculate neurons via axon collaterals of principal cells. Brain Res. 1982;236:477–481. - PubMed
    1. Ahlsén G, Lindström S, Sybirska E. Subcortical axon collaterals of principal cells in the lateral geniculate body of the cat. Brain Res. 1978;156:106–109. - PubMed
    1. Ahlsén G, Lindström S, Lo FS. Functional distinction of perigeniculate and thalamic reticular neurons in the cat. Exp Brain Res. 1982;46:118–126. - PubMed

Publication types

MeSH terms

Substances