. 2008 Mar;7(3):205-14.
doi: 10.1016/j.cmet.2007.11.016.

The transferrin receptor modulates Hfe-dependent regulation of hepcidin expression

Affiliations

The transferrin receptor modulates Hfe-dependent regulation of hepcidin expression

Paul J Schmidt et al. Cell Metab. 2008 Mar.

Abstract

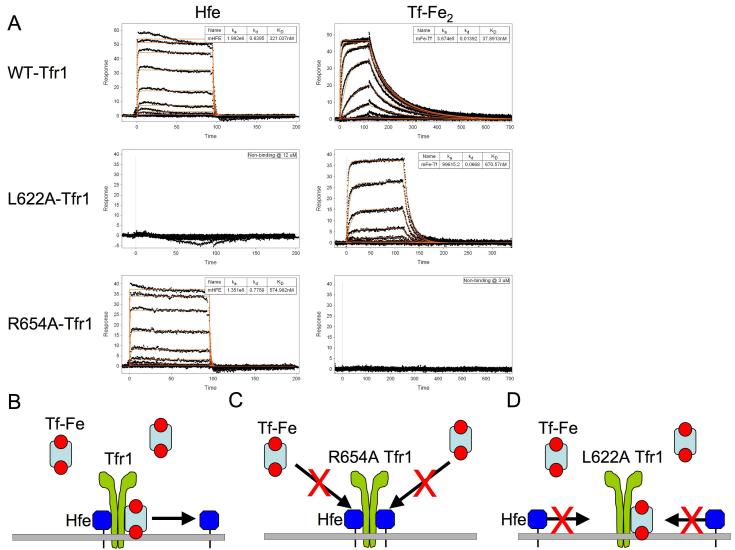
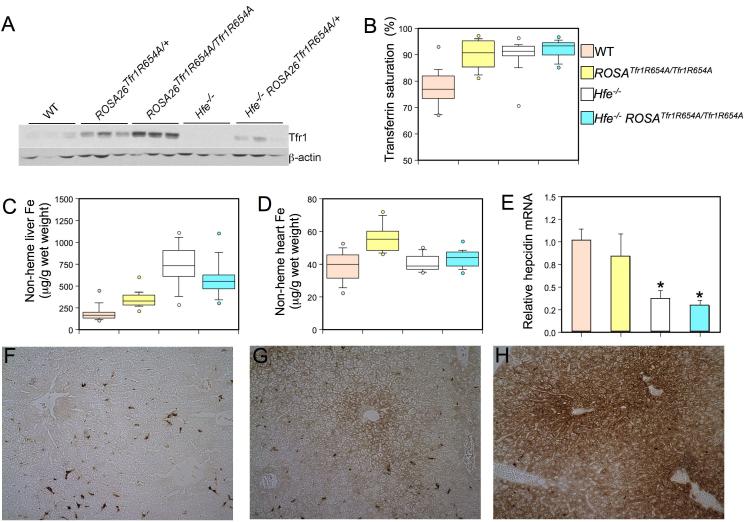
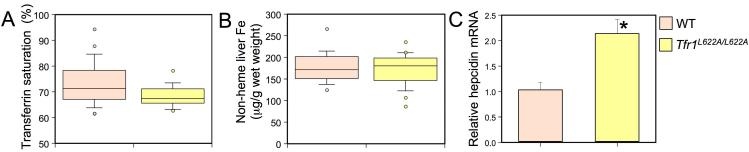
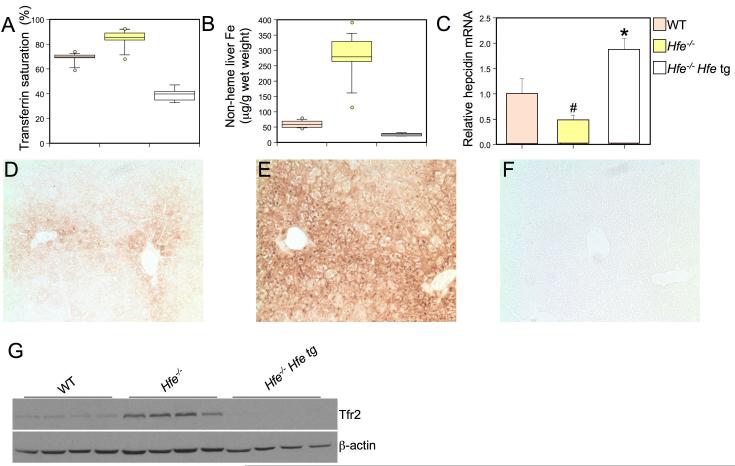
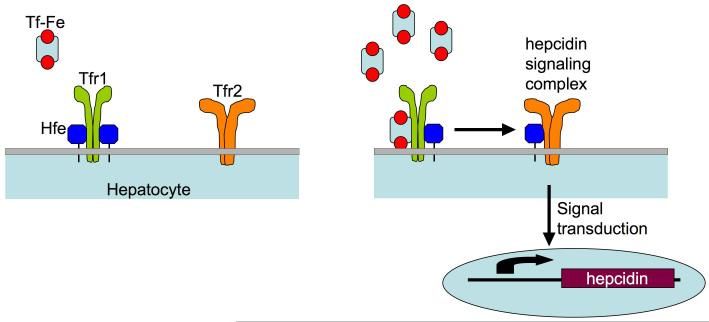
Hemochromatosis is caused by mutations in HFE, a protein that competes with transferrin (TF) for binding to transferrin receptor 1 (TFR1). We developed mutant mouse strains to gain insight into the role of the Hfe/Tfr1 complex in regulating iron homeostasis. We introduced mutations into a ubiquitously expressed Tfr1 transgene or the endogenous Tfr1 locus to promote or prevent the Hfe/Tfr1 interaction. Under conditions favoring a constitutive Hfe/Tfr1 interaction, mice developed iron overload attributable to inappropriately low expression of the hormone hepcidin. In contrast, mice carrying a mutation that interferes with the Hfe/Tfr1 interaction developed iron deficiency associated with inappropriately high hepcidin expression. High-level expression of a liver-specific Hfe transgene in Hfe-/- mice was also associated with increased hepcidin production and iron deficiency. Together, these models suggest that Hfe induces hepcidin expression when it is not in complex with Tfr1.


Figures

Figure 1
Figure 1. SPR analysis of murine Hfe and diferric transferrin binding to mutant and wild type Tfr1
Experimentally observed responses (A) are shown as black dots with best fit binding curves (red lines) derived from a 1:1 interaction model superimposed. The highest concentration protein injections are 12 μM (Hfe) and 3 μM (Fe-Tf) with subsequent injections related by a 3-fold dilution series. No binding was observed at these concentrations for Hfe binding to L622A-Tfr1 or Fe-Tf binding R654A-Tfr1. Given the concentration of proteins and the sensitivity of the SPR experiment, this suggests that the binding constants are weaker than 300 μM for Hfe and 30 μM for Fe-Tf. This is well above the physiological concentration of transferrin in serum. Model of action for wild type (B), R654A (C) and L622A (D) Tfr1 mutant proteins. The R654A Tfr1 mutation prevents Tf, but not Hfe, interaction with Tfr1. The L622A Tfr1 mutation prevents Hfe, but not Tf, binding to Tfr1.
Figure 2
Figure 2. Phenotypic analysis of ROSA26Tfr1R654A/Tfr1R654A mice
Tfr1 protein expression was analyzed (A, top panel) in wild type (WT), ROSA26Tfr1R654A/+, ROSA26Tfr1R654A/Tfr1R654A, HFE-/-, and HFE-/- ROSA26Tfr1R654A/+ 8 week-old animals by western blot analysis. Equivalent loading of liver lysate was confirmed with immunoblot analysis (bottom panel) using an anti-β-actin antibody. Box plots depicting the measurement of (B) serum Tf saturation (%), (C) non-heme liver iron (μg/g wet weight), and (D) non-heme heart iron (μg/g wet weight). Wild type (WT, n=18, a), ROSA26Tfr1R654A/Tfr1R654A (n=15, b), Hfe-/- (n=17, c), Hfe-/- ROSA26Tfr1R654A/+ (n=13, d) are depicted in salmon, yellow, white and blue, respectively. The middle bar of the box represents the median, while the top of the box is the 75th percentile and the bottom of box is the 25th percentile. The top and bottom whiskers depict the 90th and 10th percentile of the data, respectively. Data outside of the 10th and 90th percentiles are drawn as circles. P-values were calculated with Microsoft Excel (Student’s t-test). P-values: (B) a vs. b, c, or d P<0.001, (C) all groups P<0.005 except c vs. d P=NS, (D) P<0.001 a vs. b, b vs. c, b vs. d, P=NS all others. Total mRNA was harvested from ROSA26Tfr1R654A/Tfr1R654A (E) livers (n=5, results expressed as mean ± SEM) and hepcidin mRNA was assessed by quantitative real-time PCR. Mean mRNA expression for wild type mice was set as 1 and all other data was expressed in relation to this. Significant differences in mRNA expression compared to WT are denoted (*P<0.03). DAB-enhanced Perls stain (F, G and H) for iron in liver sections. Brown staining demonstrates iron accumulation in cells. Genotypes of mice are (F) wild type, (G) ROSA26Tfr1R654A/Tfr1R654A and (H) Hfe-/-.
Figure 3
Figure 3. Phenotypic analysis of Tfr1L622A/L622A mice
Box plots depicting the measurement of (A) serum Tf saturation (%) and (B) non-heme liver iron (μg/g wet weight) as in Figure 2. Wild type (WT, n=21) and Tfr1L622A/L622A (n=16) are depicted in salmon and yellow, respectively. P-values: (A) P<0.02 and (B) P=NS. Liver hepcidin mRNA was analyzed (C) and graphed as in Figure 2. Significant differences in mRNA expression compared to WT are denoted (*P<0.03).
Figure 4
Figure 4. Phenotypic analysis of mice expressing a hepatocyte-specific Hfe transgene (tg)
Box plots depicting the measurement of (A) transferrin saturation (%) and (B) non-heme liver iron (μg/g wet weight) as in Figure 2. Wild type (WT, n=14, a), Hfe-/- (n=15, b), and Hfe-/- Hfe tg (n=7, c), are depicted in salmon, yellow, and white, respectively. P-values: (A) all groups P<0.001, (B) all groups P<0.001. Liver hepcidin mRNA was analyzed (C) and graphically represented as in Figure 2. Significant differences in mRNA expression are denoted (#P<0.05, *P=0.03). DAB-enhanced Perls stain (D, E and F) for iron in liver sections. Genotypes of mice are (D) wild type, (E) Hfe-/-and (H) Hfe-/- Hfe tg. Tfr2 protein expression was analyzed (G, top panel) in wild type (WT), Hfe-/- and HFE-/- tg by western blot analysis. Equivalent loading of liver lysate was confirmed with immunoblot analysis (bottom panel) using an anti-β-actin antibody.
Figure 5
Figure 5. Model for liver-centered serum iron sensing
Hfe-Tfr1 complexes on the surface of hepatocytes sense the saturation of iron-bound transferrin in the serum. At low transferrin saturations, Hfe is sequestered by Tfr1 (left). As serum iron saturation increases, Hfe is dislodged from its overlapping binding site on Tfr1 by Fe-Tf (right). Hfe is then free to interact with Tfr2 and signal in some manner for the upregulation of hepcidin. Increased levels of circulating hepcidin lead to a reduction in both intestinal iron absorption and macrophage iron release. If either Hfe or Tfr2 is mutated or absent, the complex is unable to sense increased serum Tf saturation and dysregulation of iron homeostasis occurs.

References

    1. Aisen P, Listowsky I. Iron transport and storage proteins. Annual Reviews of Biochemistry. 1980;49:357–393. - PubMed
    1. Ajioka RS, Levy JE, Andrews NC, Kushner JP. Regulation of iron absorption in Hfe mutant mice. Blood. 2002;100:1465–1469. - PubMed
    1. Bennett MJ, Lebron JA, Bjorkman PJ. Crystal structure of the hereditary haemochromatosis protein HFE complexed with transferrin receptor. Nature. 2000;403:46–53. - PubMed
    1. Beutler E, Gelbart T, Lee P, Trevino R, Fernandez MA, Fairbanks VF. Molecular characterization of a case of atransferrinemia. Blood. 2000;96:4071–4074. - PubMed
    1. Bralet MP, Duclos-Vallee JC, Castaing D, Samuel D, Guettier C. No hepatic iron overload 12 years after liver transplantation for hereditary hemochromatosis. Hepatology. 2004;40:762. author reply 762. - PubMed

Publication types

MeSH terms