. 2008 Jun 15;17(12):1738-49.
doi: 10.1093/hmg/ddn064. Epub 2008 Mar 3.

Absence seizures in C3H/HeJ and knockout mice caused by mutation of the AMPA receptor subunit Gria4

Affiliations

Absence seizures in C3H/HeJ and knockout mice caused by mutation of the AMPA receptor subunit Gria4

Barbara Beyer et al. Hum Mol Genet. .

Abstract

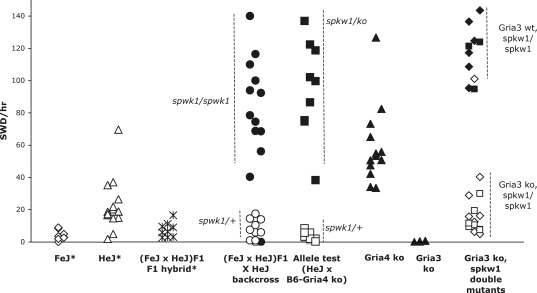
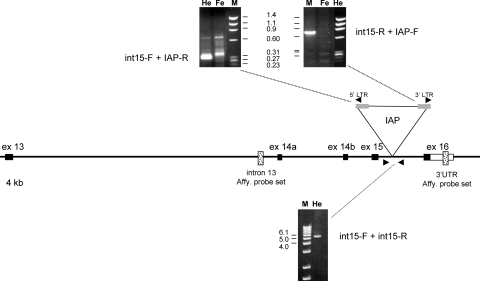
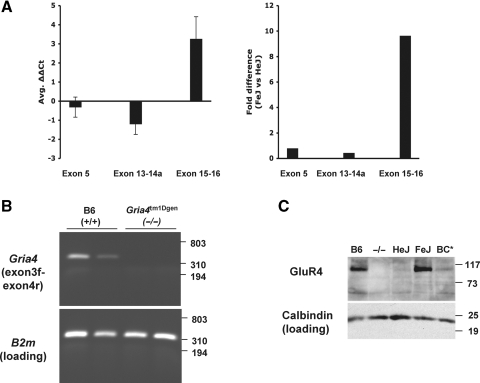
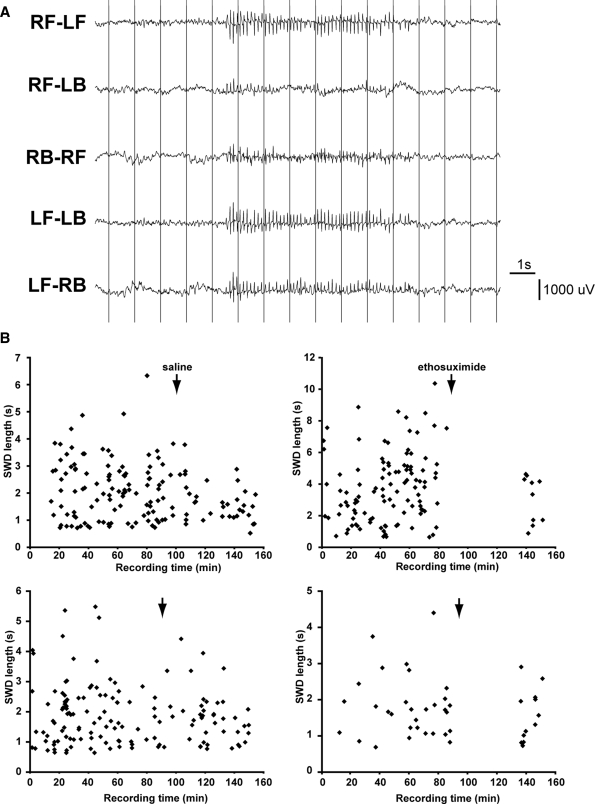
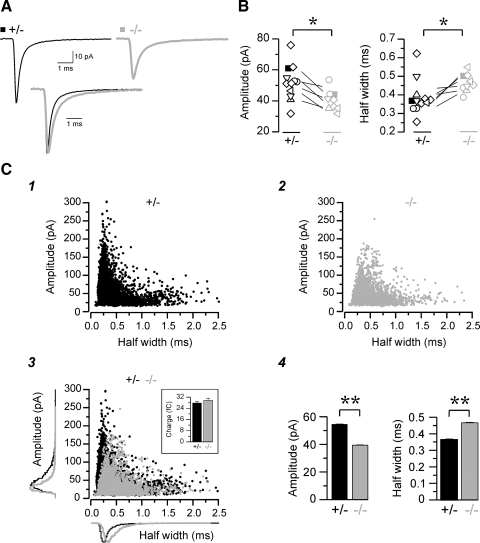
Absence epilepsy, characterized by spike-wave discharges (SWD) in the electroencephalogram, arises from aberrations within the circuitry of the cerebral cortex and thalamus that regulates awareness. The inbred mouse strain C3H/HeJ is prone to absence seizures, with a major susceptibility locus, spkw1, accounting for most of the phenotype. Here we find that spkw1 is associated with a hypomorphic retroviral-like insertion mutation in the Gria4 gene, encoding one of the four amino-3-hydroxy-5-methyl-4isoxazolepropionic acid (AMPA) receptor subunits in the brain. Consistent with this, Gria4 knockout mice also have frequent SWD and do not complement spkw1. In contrast, null mutants for the related gene Gria3 do not have SWD, and Gria3 loss actually lowers SWD of spkw1 homozygotes. Gria3 and Gria4 encode the predominant AMPA receptor subunits in the reticular thalamus, which is thought to play a central role in seizure genesis by inhibiting thalamic relay cells and promoting rebound burst firing responses. In Gria4 mutants, synaptic excitation of inhibitory reticular thalamic neurons is enhanced, with increased duration of synaptic responses-consistent with what might be expected from reduction of the kinetically faster subunit of AMPA receptors encoded by Gria4. These results demonstrate for the first time an essential role for Gria4 in the brain, and suggest that abnormal AMPA receptor-dependent synaptic activity can be involved in the network hypersynchrony that underlies absence seizures.


Figures

Figure 1.
Figure 1.
SWD incidence in mice with Gria4 and Gria3 mutations. Shown is a plot of SWD incidence, from left-to-right in FeJ, HeJ and their F1 hybrids, (*FeJ and F1 data replotted from Frankel et al. (32), HeJ are cumulative, including the previous data and 12 new datapoints), in intra-C3H backcross mice, in mice from the complementation test (‘allele test’) between HeJ (carrying Gria4spwk1) and the B6- Gria4 ko strain, in Gria4 knockouts themselves, in Gria3 knockouts and in Gria4spkw1 x Gria3 ko double mutants. In the backcross, the allele test and in double mutants, the genotypes of mice (as determined by D9Jmp26—see Materials and Methods—and additional microsatellite markers) are noted by filled versus hollow points, and the groups are labeled. The arrow denotes a rare Gria4tm1Dgen homozygote from the backcross that is SWD-resistant, presumably due to modifier loci (see text). At the far right, for double mutants, diamonds denote N2 generation and squares N4 generation. Littermate controls for the knockout mice did not show any SWD (not shown). Each point represents the average number of SWD for an individual mouse, from at least 4 h of recording on two separate days. Representative EEG traces from each genotype that displays SWD are shown in Supplementary Material, Figure S1.
Figure 2.
Figure 2.
C3H/HeJ mice have an IAP insertion in the last intron of Gria4. Shown is a map of the 3′ end of the Gria4 gene, from exon 13 to exon 16, noting the location of the IAP proviral insertion, with 5′ and 3′ long terminal repeats. Also shown are the locations of primers used to amplify the proviral-Gria4 junction fragments, as well as the entire provirus. Images of the respective amplification products are also shown from HeJ (He) and FeJ (Fe) mice, described in Materials and Methods, along with DNA markers (M, HaeIII digested bacteriophage PhiX DNA, or a ladder). Probe sets giving significant gene expression differences (see Supplementary Material, Table S1) are shown as stippled boxes.
Figure 3.
Figure 3.
Decreased GluR4 gene and protein expression in Gria4 mutant mice. (A) Differential expression of Gria4 transcript in FeJ versus HeJ mice. Shown are ΔΔCt values (left,±1SD) and approximate fold-difference ratios (right) for three different regions of the Gria4 transcript, as indicated, in cDNA prepared from adult mouse whole brain. The amount of Gria4 transcript spanning exons 15–16 is almost 10-fold lower in HeJ mice, which harbor the IAP insertion in intron 15, than in FeJ mice. (B) Gria4 transcripts from exon 3 to exon 4 are undetectable in Gria4tm1Dgen homozygotes. Shown is conventional RT–PCR from exon 3 to 4 in Gria4tm1Dgen (knockout) mice versus B6 (+/+) controls, where no transcript was detected in duplicate samples. B2 m gene transcript served as a positive control for all samples. (C) Representative (of three trials) western blot analysis of GluR4 expression in cerebellar preps from B6, Gria4tm1Dgen, C3H/HeJ, C3H/FeJ and BC* (Gria4spwk1 homozygous backcross) adult mice. Below, the calbindin level is shown as the loading control for this blot. GluR4 protein is decreased in HeJ and BC* mice, and absent from Gria4tm1Dgen homozygotes. Although cerebellum is not involved in epilepsy, here it is used as a genetic control since GluR4 is expressed very highly in this region and the antibody is not of sufficient quality to detect protein from thalamus on western blots.
Figure 4.
Figure 4.
SWDs in Gria4tm1Dgen mice. (A) Representative EEG of a Gria4tm1Dgen homozygous mouse, showing the six differential traces from the four electrodes, over the right front (RF), left front (LF), right back (RB), left back (LB) surfaces of the cerebral cortex, and a representative spike–wave burst lasting ∼6 s with its characteristic high amplitude, synchronous, rhythmic and generalized pattern. (B) Plots of SWD length and incidence in a typical recording session of four different Gria4tm1Dgen homozygous mice, treated with either 200 mg/kg ethosuximide (ETX—right side), or normal saline (left), injected subcutaneously after ∼90 min of recording (arrows). Note the cessation of SWD for 50 min post-injection, seen only in the ETX-treated mice, followed by SWD activity.
Figure 5.
Figure 5.
Spontaneous synaptic activity of the thalamic reticular nucleus in homozygous versus heterozygous Gria4spwk1 mice. (A) Spontaneous EPSCs recorded in two cells from littermate heterozygous (+/−, black) and homozygous (−/−, gray) mice. Each trace represents the average of all well-isolated individual EPSCs per cell and are plotted either separately (top panels) or normalized to the peak and overlaid (bottom). (B) Scatter representation of the mean amplitude and half width of spontaneous EPSCs recorded from individual +/− (n = 12) and −/− (n = 9) cells, each represented by a single symbol. Each type of symbol (e.g. ○,◊,□.) indicates cells belonging to the same pair of littermate +/− and −/− mice (six pairs total). Each diagonal line is the comparison between the mean responses measured for each littermate pair. One pair was examined on each experimental day. The experimenter was blinded as to mouse genotype during recording and analysis. The filled symbols correspond to the +/− and −/− littermate cells shown in (A). The overall population of cells shows significantly smaller and slower EPSCs in homozygous mice. (C) Total population of EPSCs recorded in +/− (black, n = 9032 events in 12 cells) versus −/− (gray, n = 5882 events in nine cells) mice. The scatter plots illustrate the relationship between half width and amplitude of EPSCs in +/− (C1) and −/− (C2) mice, each point representing an individual event. In panel C3, the data from C1 (+/−, black) and C2 (−/−, gray) are also shown overlapped on a single graph, together with the normalized distribution of the same parameters plotted outside the X and Y axes. Note the lack of large and fast events in −/− neurons. Plotted on C4, the corresponding histograms show a significant decrease in amplitude and increase in duration in mutants, whereas the mean synaptic charge per EPSC was slightly increased, but the changes are not significantly different (inset). *P < 0.05; **P < 0.01.

References

    1. Wyllie E. The Treatment of Epilepsy: Principles and Practice. Philadelphia: Lea & Febiger; 1993.
    1. McCormick D.A., Contreras D. On the cellular and network bases of epileptic seizures. Annu. Rev. Physiol. 2001;63:815–846. - PubMed
    1. Avanzini G., Vergnes M., Spreafico R., Marescaux C. Calcium-dependent regulation of genetically determined spike and waves by the reticular thalamic nucleus of rats. Epilepsia. 1993;34:1–7. - PubMed
    1. Jones E.G. Thalamic circuitry and thalamocortical synchrony. Philos. Trans. R. Soc. Lond. B. Biol. Sci. 2002;357:1659–1673. - PMC - PubMed
    1. Berkovic S.F., Howell R.A., Hay D.A., Hopper J.L. Epilepsies in twins: genetics of the major epilepsy syndromes. Ann. Neurol. 1998;43:435–445. - PubMed

Publication types

Substances

Associated data