. 2008 Jun;57(6):1544-55.
doi: 10.2337/db07-0507. Epub 2008 Mar 3.

A microsphere-based vaccine prevents and reverses new-onset autoimmune diabetes

Affiliations

A microsphere-based vaccine prevents and reverses new-onset autoimmune diabetes

Brett Phillips et al. Diabetes. 2008 Jun.

Abstract

Objective: This study was aimed at ascertaining the efficacy of antisense oligonucleotide-formulated microspheres to prevent type 1 diabetes and to reverse new-onset disease.

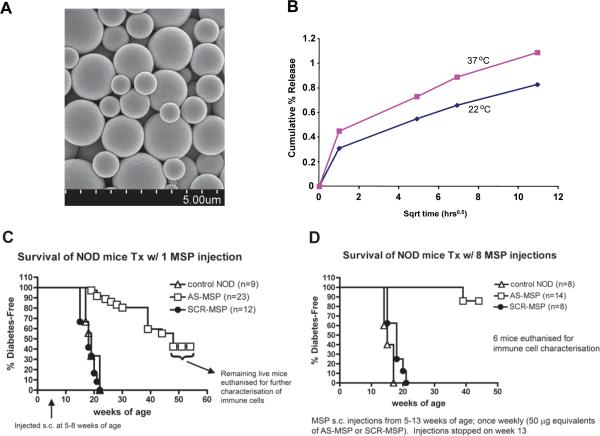
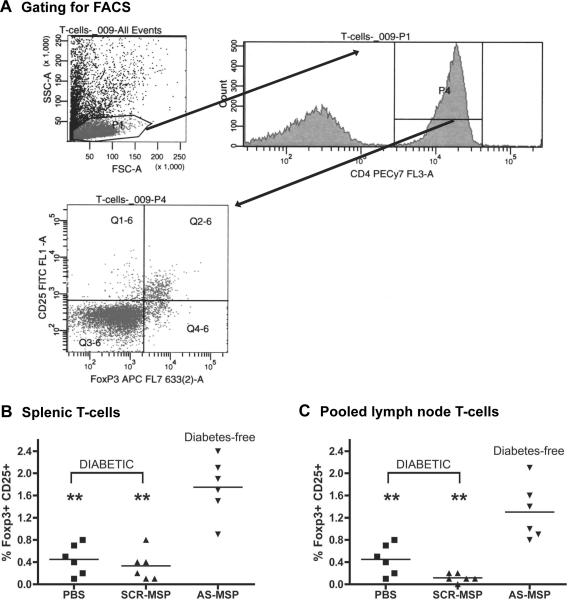
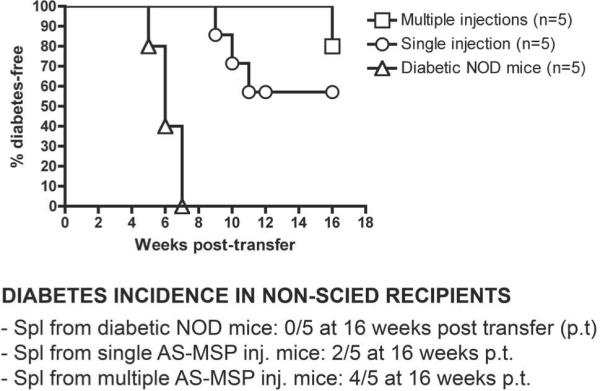
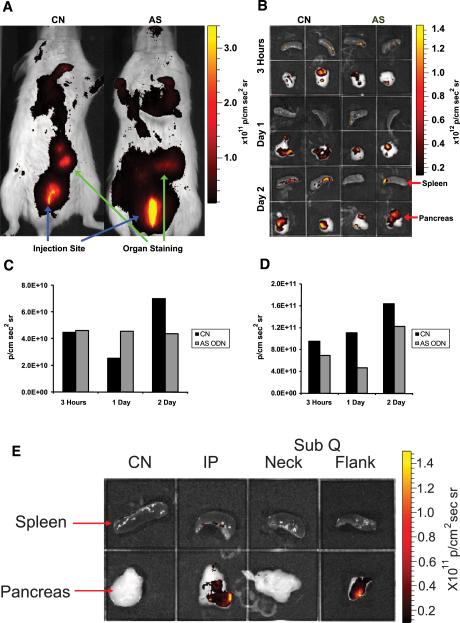
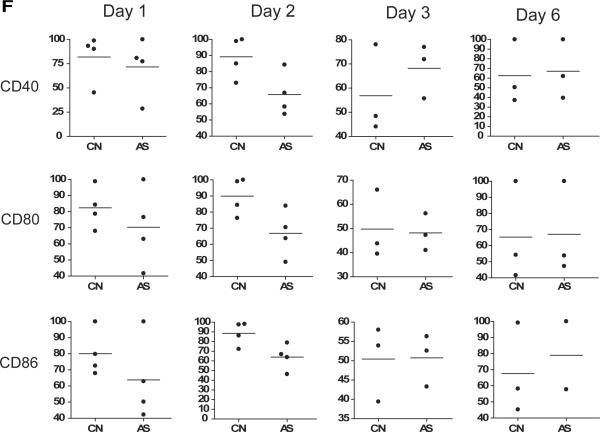
Research design and methods: Microspheres carrying antisense oligonucleotides to CD40, CD80, and CD86 were delivered into NOD mice. Glycemia was monitored to determine disease prevention and reversal. In recipients that remained and/or became diabetes free, spleen and lymph node T-cells were enriched to determine the prevalence of Foxp3(+) putative regulatory T-cells (Treg cells). Splenocytes from diabetes-free microsphere-treated recipients were adoptively cotransferred with splenocytes from diabetic NOD mice into NOD-scid recipients. Live-animal in vivo imaging measured the microsphere accumulation pattern. To rule out nonspecific systemic immunosuppression, splenocytes from successfully treated recipients were pulsed with beta-cell antigen or ovalbumin or cocultured with allogeneic splenocytes.

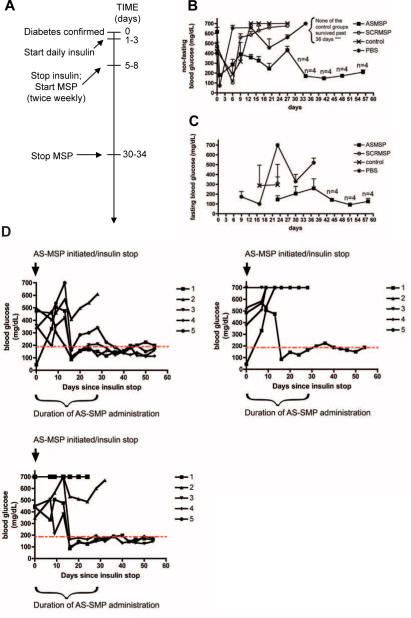
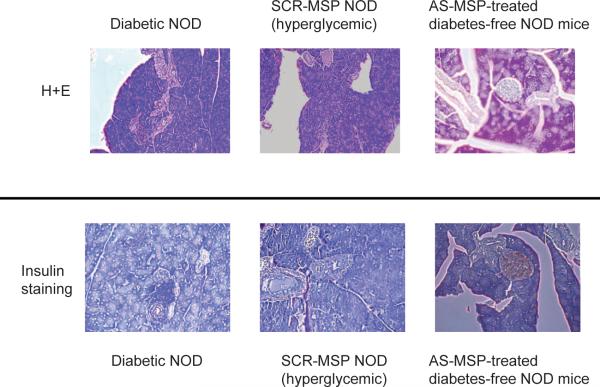
Results: The microspheres prevented type 1 diabetes and, most importantly, exhibited a capacity to reverse clinical hyperglycemia, suggesting reversal of new-onset disease. The microspheres augmented Foxp3(+) Treg cells and induced hyporesponsiveness to NOD-derived pancreatic beta-cell antigen, without compromising global immune responses to alloantigens and nominal antigens. T-cells from successfully treated mice suppressed adoptive transfer of disease by diabetogenic splenocytes into secondary immunodeficient recipients. Finally, microspheres accumulated within the pancreas and the spleen after either intraperitoneal or subcutaneous injection. Dendritic cells from spleen of the microsphere-treated mice exhibit decreased cell surface CD40, CD80, and CD86.

Conclusions: This novel microsphere formulation represents the first diabetes-suppressive and reversing nucleic acid vaccine that confers an immunoregulatory phenotype to endogenous dendritic cells.


Figures

FIG. 1
FIG. 1
A: Scanning electron micrograph of the AS-MSP. The micrograph exhibits an essentially smooth surface with particle diameters in the 1-to 4-μm size range. Size bar is shown at bottom of the micrograph.B: The cumulative percent release of antisense oligonucleotides from the microspheres. The cumulative percent release was observed to be directly proportional to the square root of time. At 22°C, ~0.8% of the oligonucleotide was released, and at 37°C,1.1% of the incorporated oligonucleotide was released. The release kinetics appears to conform to matrix diffusion release mechanism.C: AS-MSP administration into NOD mice at 5-8 weeks of age delays diabetes onset. Two groups of NOD female mice (5-8 weeks old) were given a single subcutaneous injection of microsphere-formulated antisense oligonucleotides at a site anatomically proximal to the pancreatic lymph nodes. The formulation was injected in the amount of what was considered to contain 50 mg of a 1:1:1 mixture of each antisense oligonucleotide (anti-CD40, anti-CD80, and anti-CD86) or scrambled sequences (SCR-MSP) or PBS vehicle (control). Tail vein blood glucose was measured weekly. Diabetes was confirmed after two consecutive readings of>280 -300 mg/dl. The graph shows cumulative survival of two independently treated cohorts.P<0.0001, Kaplan-Meier analysis.D: Frequent AS-MSP administration into NOD mice at 5-8 weeks of age prevents diabetes onset. NOD female mice (5-8 weeks old) were given eight consecutive single subcutaneous injections, at a site anatomically proximal to the pancreatic lymph nodes (once weekly), of microsphere-formulated antisense oligonucleotides. The formulation was injected in the amount of what was considered to contain 50 μg of a 1:1:1 mixture of each antisense oligonucleotide (anti-CD40, anti-CD80, and anti-CD86; AS-MSP) or scrambled sequences (SCR-MSP) or PBS vehicle (control). Tail vein blood glucose was measured twice weekly. Diabetes was confirmed after two consecutive readings of >280 -300 mg/dl.P < 0.0001, Kaplan-Meier analysis.
FIG. 2
FIG. 2
Multiple rounds of AS-MSP administration into new-onset diabetic NOD female mice with improved blood glucose levels; stable fasting euglycemia even after AS-MSP withdrawal. Diabetes onset was confirmed by two consecutive blood readings of >300 mg/dl. Insulin was administered daily until blood glucose fell below 300 mg/dl. Insulin was immediately stopped and the AS-MSP administrations (at a site anatomically proximal to the pancreatic lymph nodes) began as shown in the timeline (A). In some mice, AS-MSP administration was withdrawn as shown inA. The data show the mean nonfasting blood glucose (B) and the mean fasting blood glucose (C) ± SE. The graphs (D) show reversal of new-onset diabetes in separate groups of diabetic mice after multiple AS-MSP administrations as described in RESEARCH DESIGN AND METHODS.
FIG. 3
FIG. 3
Absence of insulitis and normal insulin content in pancreata of AS-MSP-treated NOD mice.Top: Hematoxylin-eosin staining of representative serial sections from diabetic, SCR-MSP diabetic, and diabetes-free AS-MSP recipients.Bottom: Insulin staining of representative serial sections from diabetic, SCR-MSP diabetic, and diabetes-free AS-MSP. Sections are representative of three randomly selected NOD mice in each group.
FIG. 4
FIG. 4
T-cells from AS-MSP-treated, diabetes-free NOD mice exhibit increased prevalence of Foxp3+ CD25+ putative Treg cells. T-cells were enriched from the spleen or the pooled lymph nodes of AS-MSP-treated diabetes-free mice selected at random from the AS-MSP diabetes-free cohort shown in Figure 1D. All mice treated with PBS or SCR-MSP developed diabetes as shown in Figure 1D. At the time of diabetes confirmation, T-cells were harvested from spleen and pooled lymph nodes. The cells were then stained intracellularly for Foxp3 and with CD25, and the percentage of double-positive cells in a lymphocyte population was determined by FACS analysis. An example of the gating is shown inA. The scatter gram inBshows the percentage of double-positive cells in individual mice at the time of euthanasia in spleen, and inC, the percentage of putative Treg cells in pooled lymph node is shown.P < 0.001 between AS-MSP-treated mice and the two controls in both graphs by Mann-WhitneyUtest.
FIG. 5
FIG. 5
Cotransfer of splenocytes from AS-MSP-treated, diabetes-free NOD mice suppresses the adoptive transfer of diabetes into NOD-scid mice by splenocytes from diabetic NOD donors. Four of five NOD-scid recipients of splenocytes from AS-MSP-treated NOD mice and diabetogenic splenocytes remained diabetes-free at 16 weeks after cell transfer, whereas only two of five and zero of five were diabetes-free after cotransfer of diabetogenic splenocytes and splenocytes from SCR-MSP and PBS-treated NOD mice, respectively. In the graphinset, Spl refers to splenocytes and p.t. refers to the time the mice were killed for further analysis after transfer. Splenocytes from randomly selected diabetes-free AS-MSP-treated mice from the treatment groups shown in Figure 1C and D(single or multiple AS-MSP injections) were cotransferred into female NOD-scid mice of 10 weeks of age along with an equal number of splenocytes (1 × 10⁷) from new-onset diabetic NOD female mice (15-18 weeks old). Diabetes was monitored once weekly in tail vein blood. Levels of >280 mg/dl at two consecutive readings were deemed to indicate diabetes. There were five NOD-scid recipients per cotransfer groups as shown below in the graph.P = 0.0003, between control and AS-MSP splenocyte recipients, Kaplan-Meier analysis.
FIG. 6
FIG. 6
In vivo accumulation of AS-MSP. NOD mice received a subcutaneous injection containing a 1:1 mix of 0.2-μm-diameter fluorescent microspheres and sterile PBS or fluorescent microspheres with 50 μg AS-MSP. A: In vivo imaging of mice was performed 3 h after injection. The injection site is clearly visible as well as regions with microsphere accumulation (anatomically located in the area of the pancreas and the spleen). B: The spleen and pancreas were removed from animals at 3, 24, and 48 h after injection and imaged. The excised spleens are in the top two panels of each quadrant (spleen from mice receiving the fluorescent microspheres+PBS on left and spleen from mice receiving the fluorescent microspheres+AS-MSP on the right), and the pancreata are shown in the bottom panels. C and D: The mean radiance per area was quantified for the excised spleen and pancreas and graphically shown below the imaging figures. The graphs represent organs from one mouse and the differences in the magnitudes of radiance are representative of organs from three separate mice. E: Comparison of intraperitoneal versus subcutaneous administration of directly labeled oligonucleotide microspheres on accumulation inside the pancreas. NOD mice were injected with. a PROMAXX formulation of a Cy3-labeled siRNA targeting the CD86 gene via subcutaneous route at a site anatomically distal and proximal to the pancreatic lymph nodes. Three hours after injection, the pancreata and spleens were harvested and imaged as described inRESEARCH DESIGN AND METHODS. CN refers to organs from mice administered PBS vehicle alone, IP refers to animals receiving microsphere-formulated Cy3-conjugated oligonucleotide by intraperitoneal route, and SubQ refers to animals receiving microsphere-formulated Cy3-conjugated oligonucleotide by subcutaneous route. Subcutaneous delivery was made into the scruff of the animal (close to the neck; NECK) and into the flank anatomically proximal to the pancreatic lymph nodes (FLANK). F: AS-MSP administration does not increase costimulatory levels on spleen-derived dendritic cells in vivo. NOD mice were treated with a 1:1 mix of fluorescent microspheres and PBS (CN) or with fluorescent microspheres and 50 μg antisense oligonucleotide mixture (AS) by subcutaneous injection. Spleens were harvested, and single cells were stained with CD40, CD80, CD86, and CD11c antibodies. The cells were analyzed by flow cytometry at days 1, 2, 3, and 6 after injection. Cell populations that stained positive for CD11c and fluorescent microspheres were then gated to measure the presence and levels of CD40, CD80, or CD86. The graphs show the median of the costimulatory molecule levels of spleen cells from individual mice (horizontal bar) as the percentage of costimulatory molecule inside a CD11c+ fluorescent bead+ gate. P < 0.05 by Mann-WhitneyU test between control and AS-MSP mix-treated mice for CD86 on day 1; for CD40, CD80, and CD86 on day 2; for CD40 on day 3
FIG. 6
FIG. 6
In vivo accumulation of AS-MSP. NOD mice received a subcutaneous injection containing a 1:1 mix of 0.2-μm-diameter fluorescent microspheres and sterile PBS or fluorescent microspheres with 50 μg AS-MSP. A: In vivo imaging of mice was performed 3 h after injection. The injection site is clearly visible as well as regions with microsphere accumulation (anatomically located in the area of the pancreas and the spleen). B: The spleen and pancreas were removed from animals at 3, 24, and 48 h after injection and imaged. The excised spleens are in the top two panels of each quadrant (spleen from mice receiving the fluorescent microspheres+PBS on left and spleen from mice receiving the fluorescent microspheres+AS-MSP on the right), and the pancreata are shown in the bottom panels. C and D: The mean radiance per area was quantified for the excised spleen and pancreas and graphically shown below the imaging figures. The graphs represent organs from one mouse and the differences in the magnitudes of radiance are representative of organs from three separate mice. E: Comparison of intraperitoneal versus subcutaneous administration of directly labeled oligonucleotide microspheres on accumulation inside the pancreas. NOD mice were injected with. a PROMAXX formulation of a Cy3-labeled siRNA targeting the CD86 gene via subcutaneous route at a site anatomically distal and proximal to the pancreatic lymph nodes. Three hours after injection, the pancreata and spleens were harvested and imaged as described inRESEARCH DESIGN AND METHODS. CN refers to organs from mice administered PBS vehicle alone, IP refers to animals receiving microsphere-formulated Cy3-conjugated oligonucleotide by intraperitoneal route, and SubQ refers to animals receiving microsphere-formulated Cy3-conjugated oligonucleotide by subcutaneous route. Subcutaneous delivery was made into the scruff of the animal (close to the neck; NECK) and into the flank anatomically proximal to the pancreatic lymph nodes (FLANK). F: AS-MSP administration does not increase costimulatory levels on spleen-derived dendritic cells in vivo. NOD mice were treated with a 1:1 mix of fluorescent microspheres and PBS (CN) or with fluorescent microspheres and 50 μg antisense oligonucleotide mixture (AS) by subcutaneous injection. Spleens were harvested, and single cells were stained with CD40, CD80, CD86, and CD11c antibodies. The cells were analyzed by flow cytometry at days 1, 2, 3, and 6 after injection. Cell populations that stained positive for CD11c and fluorescent microspheres were then gated to measure the presence and levels of CD40, CD80, or CD86. The graphs show the median of the costimulatory molecule levels of spleen cells from individual mice (horizontal bar) as the percentage of costimulatory molecule inside a CD11c+ fluorescent bead+ gate. P < 0.05 by Mann-WhitneyU test between control and AS-MSP mix-treated mice for CD86 on day 1; for CD40, CD80, and CD86 on day 2; for CD40 on day 3

References

    1. Atkinson MA, Eisenbarth GS. Type 1 diabetes: new perspectives on disease pathogenesis and treatment. Lancet. 2001;358:221–229. - PubMed
    1. Thomas HE, Darwiche R, Corbett JA, Kay TW. Interleukin-1 plus gamma-interferon-induced pancreatic β-cell dysfunction is mediated by β-cell nitric oxide production. Diabetes. 2002;51:311–316. - PubMed
    1. Arnush M, Heitmeier MR, Scarim AL, Marino MH, Manning PT, Corbett JA. IL-1 produced and released endogenously within human islets inhibits beta cell function. J Clin Invest. 1998;102:516–526. - PMC - PubMed
    1. Abdul-Rasoul M, Habib H, Al-Khouly M. “The honeymoon phase ” in children with type 1 diabetes mellitus: frequency, duration, and influential factors. Pediatr Diabetes. 2006;7:101–107. - PubMed
    1. Bougneres PF, Landais P, Boisson C, Carel JC, Frament N, Boitard C, Chaussain JL, Bach JF. Limited duration of remission of insulin dependency in children with recent overt type I diabetes treated with low-dose cyclosporin. Diabetes. 1990;39:1264–1272. - PubMed

Publication types