. 2008 May;76(5):1908-19.
doi: 10.1128/IAI.01233-07. Epub 2008 Mar 3.

Functional analysis of effector and regulatory T cells in a parasitic nematode infection

Affiliations

Functional analysis of effector and regulatory T cells in a parasitic nematode infection

Sebastian Rausch et al. Infect Immun. 2008 May.

Abstract

Parasitic nematodes typically modulate T-cell reactivity, primarily during the chronic phase of infection. We analyzed the role of CD4-positive (CD4+) T effector (T(eff)) cells and regulatory T (T(reg)) cells derived from mice chronically infected with the intestinal nematode Heligmosomoides polygyrus. Different CD4+ T-cell subsets were transferred into naïve recipients that were subsequently infected with H. polygyrus. Adoptive transfer of conventional T(eff) cells conferred protection and led to a significant decrease in the worm burdens of H. polygyrus-infected recipients. Roughly 0.2% of the CD4+ T cells were H. polygyrus specific based on expression of CD154, and cells producing interleukin 4 (IL-4) and IL-13 were highly enriched within the CD154+ population. In contrast, adoptive transfer of T(reg) cells, characterized by the markers CD25 and CD103 and the transcription factor Foxp3, had no effect on the worm burdens of recipients. Further analysis showed that soon after infection, the number of Foxp3+ T(reg) cells temporarily increased in the inflamed tissue while effector/memory-like CD103+ Foxp+ T(reg) cells systemically increased in the draining lymph nodes and spleen. In addition, T(reg) cells represented a potential source of IL-10 and reduced the expression of IL-4. Finally, under in vitro conditions, T(reg) cells from infected mice were more potent suppressors than cells derived from naïve mice. In conclusion, our data indicate that small numbers of T(eff) cells have the ability to promote host protective immune responses, even in the presence of T(reg) cells.


Figures
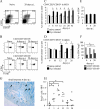
FIG. 1.
FIG. 1.
Comparison of Treg numbers in naive and H. polygyrus (H.p.)-infected mice. (A) Treg cells were detected by flow cytometry based on surface expression of CD4, CD25, and CD103. Shown are plots derived from CD4+ MLNC of naïve and chronically infected animals. The data are representative of four animals per group and four independent experiments. (B) The predominantly regulatory phenotype of CD4+ CD25+ CD103 (top) and CD4+ CD25+ CD103+ (bottom) cells derived from MLNs could be confirmed by intracellular staining of Foxp3. Four animals per group were analyzed in two independent experiments. (C and D) The frequencies of CD25+ CD103+ cells within CD4+ lymphocytes as detected in MLNs (C) and spleens (D) of animals at different time points after infection (black bars) compared to naïve controls (open bars). The data were derived from four animals per group, and analysis of Treg cell numbers was performed at least twice for each time point. Means plus standard errors of the mean (SEM) are shown. (E) Frequencies of total Foxp3+ cells within CD4+ lymphocytes from MLN. Means plus SEM of four animals per group are shown. The data are representative of two independent experiments. (F) Proportion of CD25+ CD103 and CD25+ CD103+ cells in CD4+ Foxp3+ cells. Means plus SEM of four animals per group are shown. The data are representative of two independent experiments. (G) Cross sections of the proximal third of the small intestine were stained for Foxp3-expressing cells. Foxp3+ Treg cells were found in the epithelium and in the lamina propria (depicted by black arrowheads). The white arrowheads indicate tissue-dwelling larvae of H. polygyrus at day 6 p.i. (H) Significant increases in Treg cells within the intestine were detected on days 3, 6, and 12 p.i. Stained cells in 10 high-power fields (HPF) (40-fold magnification) per animal were counted. Means of single animals (closed circles) and means of groups (horizontal lines) are shown. *, significant difference between naïve and infected animals as determined by the Mann-Whitney test (P < 0.05).
FIG. 2.
FIG. 2.
Cytokine production of MLNC during H. polygyrus infection. (A to D) The cytokine response of MLNC after restimulation with H. polygyrus adult worm antigen was analyzed with cells from animals at days 6, 12, and 28 p.i. The cytokine response of complete MLNC (open bars) was compared to that of MLNC depleted of cells expressing CD25 and CD103 (hatched bars). IFN-γ (A), IL-4 (B), IL-13 (C), and IL-10 (D) production was analyzed. The means plus standard deviations (SD) of three cell pools of two animals each are shown. *, statistical significance comparing cytokine responses before and after depletion as determined by two-way ANOVA, followed by Bonferroni posttests (P < 0.05). The data are representative of two independent experiments. (E) The efficiency of Treg depletion was determined by flow cytometry. The expression of CD25 and CD103 (upper row) and Foxp3 (lower row) in CD4+ cells before (left) and after (right) depletion is shown. (F) The relative expression of IL-4 and IL-10 mRNAs by CD4+ T-cell subsets after coincubation with H. polygyrus-primed DC was assessed at day 6 p.i. Means plus SD of three measurements are shown.
FIG. 3.
FIG. 3.
Influence of adoptive CD4+ T-cell transfer on adult worm burden. T cells of the indicated subtypes (5 × 10⁵) obtained from MLNs and spleens of chronically H. polygyrus-infected mice were transferred to recipients that were subsequently infected with H. polygyrus larvae. Control animals received PBS only. (A) Purity of transferred cells as determined by flow cytometry. Representative data from one of three independent experiments are shown. (B) Adult worm burden in recipients 28 days p.i. Worm counts are shown as percentages of the number of applied larvae. Group sizes varied between 5 and 20 animals. The data originated from three individual experiments. Individual worm counts and medians are shown. The asterisks show statistical significance as determined by a Kruskal-Wallis test followed by a Mann-Whitney test: *, P < 0.05; **, P < 0.01. (C) Tracing of transferred cells in C57BL/6 mice receiving 1 × 10⁷ CD4+ cells from chronically infected EGFP-expressing donors. The recipients were infected with H. polygyrus the following day. Examples of flow cytometry plots derived from splenocytes, MLNC, and small-intestinal IEL and LPL 6 days after transfer are shown. (D) Percentages of EGFP+ cells within lymphocytes of recipients. Means plus standard deviations for four animals are shown. The data are representative of two experiments.
FIG. 4.
FIG. 4.
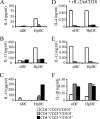
Cytokine production by CD4+ T-cell subsets. CD4+ T cells were isolated from pooled MLNC and splenocytes of eight mice in the chronic phase of infection (28 days p.i.) according to the indicated surface marker expression. T-cell subsets were incubated for 72 h with naïve bone marrow-derived DC (nDC) or DC pretreated with H. polygyrus adult worm antigen (HpDC). (A to C) Release of IL-4 (A), IL-13 (B), and IL-10 (C) was detected by ELISA. Means plus standard deviations (SD) of triplicate determinations are shown, and the data are representative of three independent experiments. (D to F) Release of IL-4 (D), IL-13 (E), and IL-10 (F) after addition of recombinant mouse IL-2 and αCD28 to cultures. Mean values plus SD of triplicate determinations of one of two independent experiments with similar results are shown.
FIG. 5.
FIG. 5.
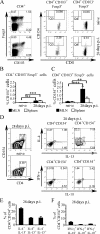
Distribution of antigen-specific CD4+ T cells (CD154+) and their cytokine responses. (A) Shown are examples of fluorescence-activated cell sorter plots of MLNC from naïve mice (upper row) and H. polygyrus-infected mice at day 28 p.i. (lower row). The cells were restimulated with H. polygyrus antigen in vitro and stained for CD4, CD154, CD103, and Foxp3. CD4+ cells were plotted for expression of CD103 and Foxp3 (left). The middle plots show CD154 expression within the CD4+ CD103+ Foxp3 effector population. The right-hand plots show CD154 expression by CD4+ CD103 Foxp3 effectors. (B and C) Frequencies of CD154-expressing cells within the CD4+ CD103 Foxp3 (B) and CD4+ CD103+ Foxp3 (C) effector populations of MLNs (black bars) and spleens (open bars) after restimulation in vitro. The data were obtained from eight infected and seven naïve mice. Means plus standard errors of the mean (SEM) are shown. The data are representative of three independent experiments. (D) Intracellular staining of cytokines within restimulated CD4+ T cells from spleens (28 days p.i.). The cells were gated for expression of CD4 and CD154 (left), and IL-4 and IL-13 (upper row) or IFN-γ and IL-10 (lower row) were determined in CD4+ CD154 cells (center) and CD4+ CD154+ cells (right). The cytometry plots shown are representative of a group of eight infected mice. (E) IL-4/IL-13 and IFN-γ/IL-10 (F) responses in CD4+ CD154+ cells after restimulation with H. polygyrus antigen. Means plus SEM of eight animals are shown. The asterisks show statistical significance comparing cells from naïve and infected animals as determined by the Mann-Whitney test: **, P < 0.01; ***, P < 0.001.
FIG. 6.
FIG. 6.
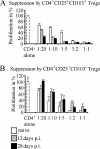
Suppressive capacities of Treg cells in vitro. CD4+ CD25+ CD103 and CD4+ CD25+ CD103+ Treg cells were purified from splenocytes and MLNC of H. polygyrus-infected (12 and 28 days p.i.) and naïve mice. CD4+ CD25 CD103 responder cells were isolated from naïve animals. (A and B) The suppressive capacities of CD4+ CD25+ CD103+ Treg cells (A) and of CD4+ CD25+ CD103 Treg cells (B) from naïve mice (open bars) and infected animals at the acute phase (12 days p.i.) (gray bars) or chronic phase (28 days p.i.) (black bars) of infection were analyzed. The ratios of Treg cells and responder CD4+ T cells are indicated. Proliferation of CD4+ T cells after stimulation with αCD3 antibodies was detected by [3H]thymidine uptake. Means plus standard errors of the mean of quintuple determinations are shown. The data shown are representative of two independent experiments.

References

    1. Akiho, H., Y. Deng, P. Blennerhassett, H. Kanbayashi, and S. M. Collins. 2005. Mechanisms underlying the maintenance of muscle hypercontractility in a model of postinfective gut dysfunction. Gastroenterology 129131-141. - PubMed
    1. Al-Qaoud, K. M., B. Fleischer, and A. Hoerauf. 1998. The Xid defect imparts susceptibility to experimental murine filariosis—association with a lack of antibody and IL-10 production by B cells in response to phosphorylcholine. Int. Immunol. 1017-25. - PubMed
    1. Anderson, C. F., M. Oukka, V. J. Kuchroo, and D. Sacks. 2007. CD4+CD25−Foxp3− Th1 cells are the source of IL-10-mediated immune suppression in chronic cutaneous leishmaniasis. J. Exp. Med. 204285-297. - PMC - PubMed
    1. Anthony, R. M., J. F. Urban, Jr., F. Alem, H. A. Hamed, C. T. Rozo, J. L. Boucher, N. Van Rooijen, and W. C. Gause. 2006. Memory TH2 cells induce alternatively activated macrophages to mediate protection against nematode parasites. Nat. Med. 12955-960. - PMC - PubMed
    1. Babu, S., C. P. Blauvelt, V. Kumaraswami, and T. B. Nutman. 2006. Regulatory networks induced by live parasites impair both TH1 and TH2 pathways in patent lymphatic filariasis: implications for parasite persistence. J. Immunol. 1763248-3256. - PubMed

Publication types

MeSH terms