. 2008 Mar 17;205(3):625-40.
doi: 10.1084/jem.20071641. Epub 2008 Mar 3.

Functional and genomic profiling of effector CD8 T cell subsets with distinct memory fates

Affiliations

Functional and genomic profiling of effector CD8 T cell subsets with distinct memory fates

Surojit Sarkar et al. J Exp Med. .

Abstract

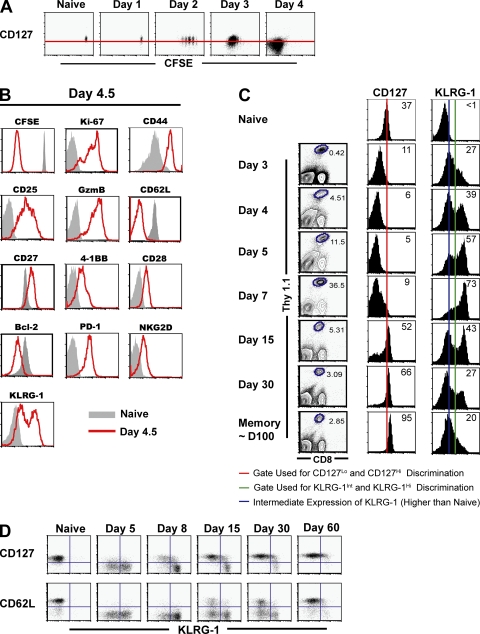
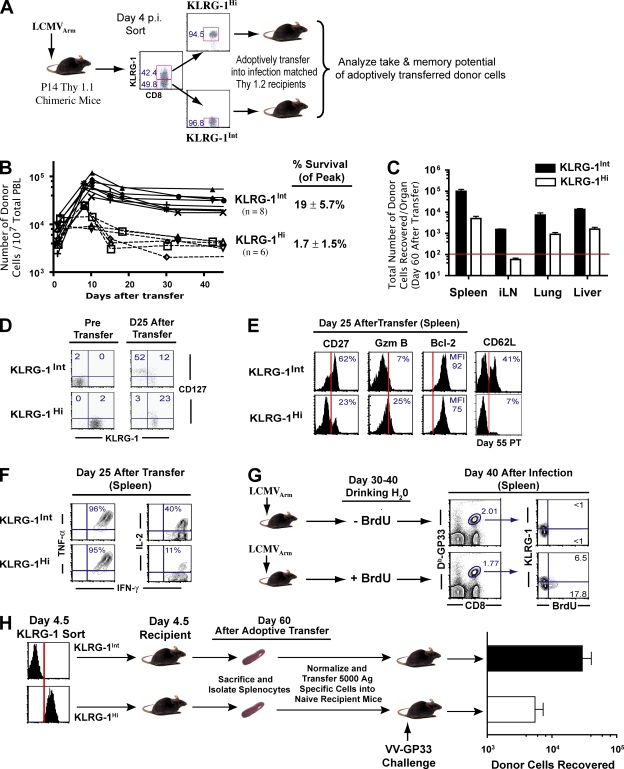
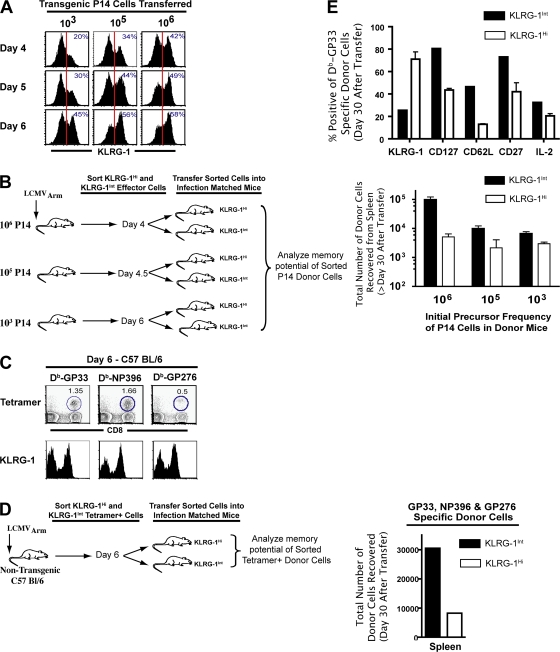
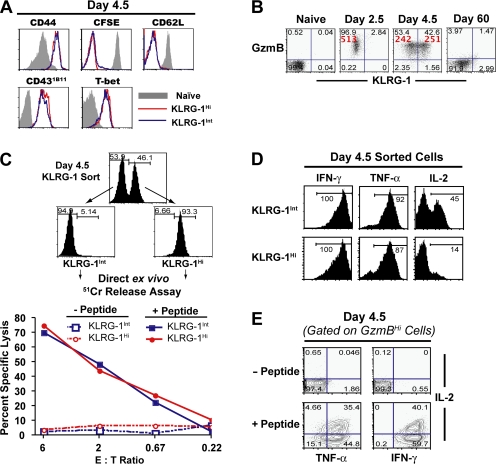
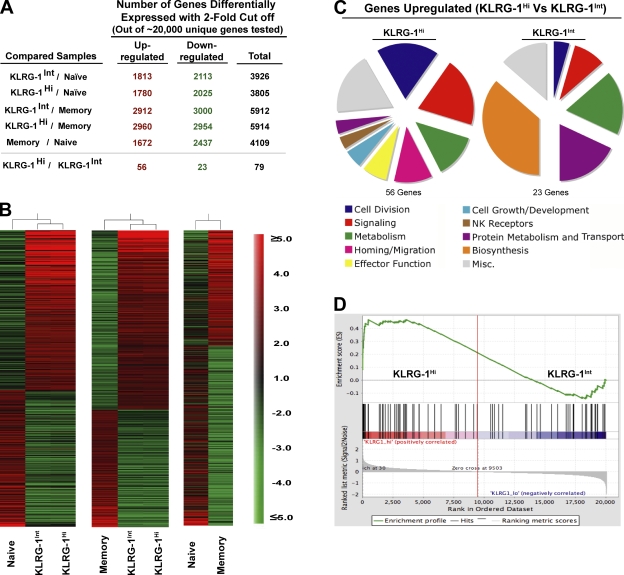
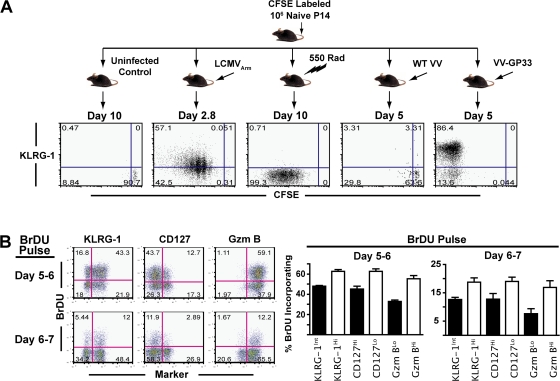
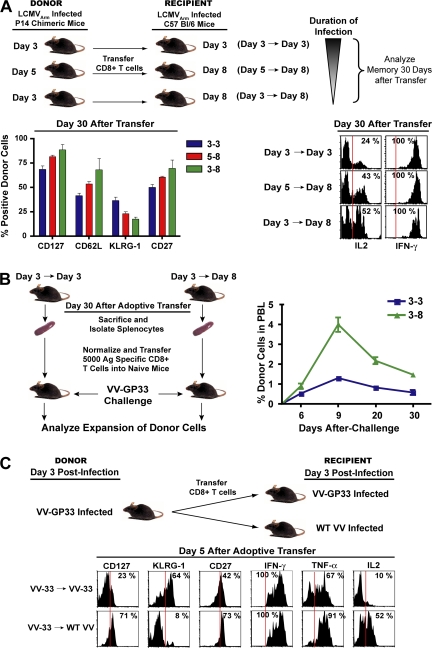
An important question in memory development is understanding the differences between effector CD8 T cells that die versus effector cells that survive and give rise to memory cells. In this study, we provide a comprehensive phenotypic, functional, and genomic profiling of terminal effectors and memory precursors. Using killer cell lectin-like receptor G1 as a marker to distinguish these effector subsets, we found that despite their diverse cell fates, both subsets possessed remarkably similar gene expression profiles and functioned as equally potent killer cells. However, only the memory precursors were capable of making interleukin (IL) 2, thus defining a novel effector cell that was cytotoxic, expressed granzyme B, and produced inflammatory cytokines in addition to IL-2. This effector population then differentiated into long-lived protective memory T cells capable of self-renewal and rapid recall responses. Experiments to understand the signals that regulate the generation of terminal effectors versus memory precursors showed that cells that continued to receive antigenic stimulation during the later stages of infection were more likely to become terminal effectors. Importantly, curtailing antigenic stimulation toward the tail end of the acute infection enhanced the generation of memory cells. These studies support the decreasing potential model of memory differentiation and show that the duration of antigenic stimulation is a critical regulator of memory formation.


Figures

Figure 1.
Figure 1.
Effector CD8 T cells uniformly down-regulate CD127 but can be distinguished on the basis of KLRG-1 expression. (A) Cell-surface expression of IL-7Rα with respect to cell division at days 1–4 after LCMV infection. 106 naive CFSE-labeled P14 CD8 T cells were adoptively transferred into naive mice that were subsequently infected with LCMV. All plots are gated on CD8+ Thy1.1+ P14 splenocytes directly stained ex vivo for IL-7Rα expression. An uninfected naive control is also shown, and the red horizontal line indicates the naive level of expression. (B) Phenotypic properties of CD127Lo antigen-specific cells at day 4.5 p.i. B6 mice containing ∼105 naive Thy1.1+ P14 cells were infected with LCMV, and expression of the indicated cell-surface and intracellular markers on CD8+ Thy1.1+ splenocytes was assessed 4.5 d later (red line histograms). Gray histograms represent naive cells from uninfected control mice. (C) Longitudinal analysis of cell-surface IL-7Rα and KLRG-1 expression. B6 mice containing ∼105 naive Thy1.1+ P14 cells were infected with LCMV, and the cell-surface expression of IL-7Rα and KLRG-1 was analyzed at the indicated time points. Histograms depict the MFI of IL-7Rα expression and percentages of KLRG-1Hi cells gated on CD8+ Thy1.1+ P14 cells. (D) Inverse association of KLRG-1 expression with the memory markers CD127 and CD62L. B6 mice containing 105 CD8+ Thy1.1+ P14 cells were infected with LCMV, and KLRG-1 expression with respect to CD127 or CD62L was analyzed at the indicated time points.
Figure 2.
Figure 2.
Heterogeneity in KLRG-1 expression identifies effector CD8 T cells with distinct memory lineage fates. KLRG-1Int effector cells preferentially give rise to long-lived memory cells. (A) KLRG-1Int and KLRG-1Hi cells were sorted from B6 mice containing 106 Thy1.1+ P14 cells 4 d after LCMV infection. Equal numbers (∼106) of sorted cells were transferred into infection-matched Thy1.2 recipients. The numbers indicate percentages of corresponding gated populations. (B) Expansion and contraction of adoptively transferred KLRG-1Int and KLRG-1Hi cells was longitudinally assessed in the blood of recipient mice by staining for the Thy1.1+ marker. (C) Long-term survival of the sorted donor KLRG-1Int and KLRG-1Hi effector cells was determined by enumerating the total number of donor cells in the spleen, lymph node, lung, liver, and blood ∼60 d after adoptive transfer. The horizontal red line indicates the lower limit of detection for absolute numbers of antigen-specific cells. Mean data from six to eight mice are presented, and error bars represent SEM. (D and E) Detailed phenotypic characterization of surviving KLRG-1Int and KLRG-1Hi donor cells in spleens at memory. Percentages of donor cells expressing the indicated markers are depicted. The MFI of Bcl-2 expression is presented. Vertical red lines indicate the negative expression gate for the respective markers. (F) Cytokine production by donor cells at day 25 after transfer. Production of intracellular cytokines (IFN-γ, TNF-α, and IL-2) in Thy1.1+ donor cells was evaluated after 5 h of stimulation with GP33-41 peptide in the presence of BFA in vitro. Percentages of donor cells producing IFN-γ, TNF-α, and IL-2 are depicted in the respective histograms. (G) Homeostatic proliferation of KLRG-1Int and KLRG-1Hi memory cells was assessed in LCMV-infected B6 mice. Immune mice were fed BrdU in their drinking water between days 30 and 40 p.i. Subsequently, BrdU incorporation in KLRG-1Int and KLRG-1Hi splenic DbGP33–specific memory cells was evaluated by flow cytometry. The numbers indicate percentages of corresponding gated populations. (H) Recall proliferation and boosting ability of KLRG-1Int and KLRG-1Hi memory cells. KLRG-1Int and KLRG-1Hi P14 cells were adoptively transferred into infection-matched mice; 30 d later, equal numbers of surviving memory cells (Thy 1.1+) from each group were transferred into Thy1.2+ naive mice, which were infected i.v. with 2 × 10⁶ PFU VV-GP33. Donor cells recovered from the spleen at day 60 after challenge are plotted. Mean data from six mice are presented, and error bars represent SEM.
Figure 3.
Figure 3.
Diverse cell fates associated with KLRG-1Int and KLRG-1Hi effector CD8 T cells are independent of initial precursor frequencies of antigen-specific cells and are seen with both Tg T cells and endogenous cells in normal B6 mice. (A) B6 mice adoptively transferred with low (103) or high (105 or 106) doses of naive P14 cells were infected with LCMV. CD8+ Thy1.1+ donor cells in the spleen were analyzed for cell-surface KLRG-1 expression at days 4, 5, and 6 p.i. Vertical red lines indicate the gate for intermediate KLRG-1 expression. (B) KLRG-1Int and KLRG-1Hi effector cells were sorted from B6 mice containing 106, 105, or 103 naive P14 cells at days 4, 4.5, and 6 p.i., respectively. KLRG-1Int and KLRG-1Hi donors from each group were transferred into infection-matched recipients, and total numbers of memory cells in the spleen were enumerated at days 40–60 after transfer. Mean data are plotted, and error bars represent SEM. (C) Non-Tg B6 mice were infected with LCMV, and 6-d p.i. cell-surface expression of KLRG-1 on DbGP33-, DbNP396-, and DbGP276-specific CD8 T cells was assessed using anti-CD8α, anti–KLRG-1, and the respective MHC class I tetramers. Numbers show the frequency of tetramer-positive cells. (D) Tetramer-specific cells were sorted into KLRG-1Int and KLRG-1Hi populations from Thy1.2+ B6 mice infected with LCMV 6 d earlier. A total of 1.5 × 10⁶ KLRG-1Hi– and KLRG-1Int–sorted DbGP33+ DbNP396+ DbGP276+ cells were transferred into infection-matched Thy1.1 recipients. Total numbers of DbGP33+ DbNP396+ DbGP276+ donor cells in the spleen are shown at 20 d after transfer. (E) Surface markers were analyzed on DbGP33-specific CD8 T cells by direct ex vivo staining of splenocytes, and production of IL-2 by memory cells was determined by ex vivo stimulation with GP33 peptide for 5 h. Bar graphs represent the fraction of donor cells expressing the indicated markers. Mean data are plotted, and error bars represent SEM.
Figure 4.
Figure 4.
Memory cells differentiate from a novel IL-2–producing effector CD8 T cell subset capable of granzyme B production and direct ex vivo killing. (A) Phenotypic characterization of KLRG-1Int (blue lines) and KLRG-1Hi (red lines) subsets at day 4.5 p.i. B6 mice containing ∼105 naive P14 cells were infected with LCMV, and the cell-surface expression of the indicated phenotypic markers on the donor cells was analyzed with respect to KLRG-1 expression at day 4.5 p.i. All plots are gated on CD8+ Thy1.1+ donor cells. Gray histograms represent naive controls. For analysis of cell proliferation, naive donor cells were labeled with CFSE before adoptive transfer and infection. (B) Direct ex vivo granzyme B production by naive P14 cells and P14 cells at days 2.5, 4.5, and 60 p.i. Granzyme B expression with respect to KLRG-1 expression in Thy1.1+ splenocytes is presented as dot plots, and quadrant frequencies are indicated. The MFI of granzyme B expression is given in red. (C) Direct ex vivo cytolytic activity of KLRG-1Int– and KLRG-1Hi–sorted cells during expansion. A standard 5-h Cr release assay was performed to assess direct ex vivo cytolytic activity of the KLRG-1Int and KRG-1Hi effector cells at the indicated effector/target cell ratios. (D) Production of IFN-γ, TNF-α, and IL-2 by FACS-purified KLRG-1Int and KLRG-1Hi effector cells at day 4.5 p.i. was evaluated after 5 h of in vitro stimulation with GP33-41 peptide in the presence of BFA. Percentages of cytokine-producing cells are indicated. (E) IFN-γ, TNF-α, and IL-2 production by day 4.5 granzyme B–expressing effector cells is shown. Plots are gated on CD8+ Thy1.1+ granzyme B+ cells, and quadrant frequencies are indicated.
Figure 5.
Figure 5.
Genome-wide microarray analysis of memory precursors and terminal effectors. Expression levels of mRNA were measured by microarray analysis of sorted P14 CD44Lo naive cells, KLRG-1Int and KLRG-1Hi effector cells at day 4.5 p.i., and P14 memory cells at day 60 p.i. Gene ratios (fold change) represent the mean value of three to four independent hybridizations to Affymetrix microarrays. (A) Total number of transcripts differentially expressed (up- or down-regulated; twofold cutoff) between the indicated comparison groups is shown. (B) Relative intensities of all genes with a 2.5-fold cutoff in KLRG-1Int and KLRG-1Hi cells with respect to naive and memory populations are plotted as heat maps to depict the relationship between various populations. (C) All genes differentially expressed (twofold cutoff) between KLRG-1Int and KLRG-1Hi cells are functionally classified under broad categories based on information found in the Gene Ontology and Ingenuity Pathways databases and plotted as pie charts. (D) Enrichment profile of effector signature genes in KLRG-1Hi versus KLRG-1Int effector cells. GSEA of a set of genes corresponding to differentiated effectors (D8) in the rank-ordered list of genes differentially expressed between KLRG-1Int versus KLRG-1Hi effector cells is shown.
Figure 6.
Figure 6.
Effector cells that continue to proliferate toward the tail end of antigen clearance contribute less to the long-lived memory lineage. (A) Cell-surface expression of KLRG-1 with respect to cell division at the indicated days after infection with LCMV, WT-VV, VV-GP33, or γ irradiation was evaluated using106 CFSE-labeled P14 CD8 T cells. All plots are gated on CD8+ Thy1.1+ P14 splenocytes stained directly ex vivo, and quadrant frequencies are indicated. (B) B6 mice containing 106 Thy1.1+ P14 cells were administered 1 mg BrdU i.p. per mouse at day 5 or 6 p.i. BrdU incorporation in CD8+ Thy1.1+ cells was assessed at the end of the pulse with respect to KLRG-1, CD127, and granzyme B expression. Percentages of BrdU+ cells were calculated within effector subsets expressing higher or lower levels of KLRG-1, CD127, and granzyme B and are summarized as bar graphs with mean and SEM.
Figure 7.
Figure 7.
Curtailing antigenic stimulation toward later stages of infection enhances memory generation potential of effector cells. (A) B6 mice containing 106 Thy1.1+ P14 cells were infected with LCMV and CD8+ splenocytes were isolated at days 3 and 5 p.i. and adoptively transferred into day 8 LCMV-infected recipients. Day 3 cells were also transferred into infection-matched day 3 recipients as controls. Donor cells were analyzed for cell-surface expression of CD62L, CD127, KLRG-1, and CD27 30 d after transfer. Bar graphs indicate mean with SEM. Production of IL-2 and IFN-γ by donor cells are plotted as histograms. (B) Recall proliferation potential of donor cells isolated from spleens 30 d after transfer was analyzed. Equal numbers of memory cells from each group were transferred into Thy1.2 naive mice. 1 d later, recipient mice were infected i.p. with 2 × 10⁶ PFU VV-GP33. The expansion of donor cells was longitudinally assessed in blood by staining for cell-surface CD8 and Thy1.1. Data are plotted as the mean ± SEM. (C) C57BL/6 mice containing 106 Thy1.1+ P14 cells were infected with VV-GP33. At day 3 after infection, CD8+ splenocytes were isolated and adoptively transferred into either into VV-GP33–infected or WT-VV–infected recipient mice. Donor cells were analyzed for cell-surface expression of CD127, KLRG-1, and CD27 5 d after transfer. Production of ex vivo IFN-γ, TNF-α, and IL-2 cytokines by donor cells was also analyzed after stimulation with GP33-41 peptide. Vertical red lines in B and D indicate the negative expression gate for the respective markers.

References

    1. Welsh, R.M., L.K. Selin, and E. Szomolanyi-Tsuda. 2004. Immunological memory to viral infections. Annu. Rev. Immunol. 22:711–743. - PubMed
    1. Ahmed, R., and B.T. Rouse. 2006. Immunological Memory. Immunol. Rev. 211:5–7.
    1. Badovinac, V.P., and J.T. Harty. 2006. Programming, demarcating, and manipulating CD8+ T-cell memory. Immunol. Rev. 211:67–80. - PubMed
    1. Fearon, D.T., J.M. Carr, A. Telaranta, M.J. Carrasco, and J.E. Thaventhiran. 2006. The rationale for the IL-2-independent generation of the self-renewing central memory CD8+ T cells. Immunol. Rev. 211:104–118. - PubMed
    1. Kalia, V., S. Sarkar, T.S. Gourley, B.T. Rouse, and R. Ahmed. 2006. Differentiation of memory B and T cells. Curr. Opin. Immunol. 18:255–264. - PubMed

Publication types

MeSH terms