A human breast cell model of preinvasive to invasive transition
- PMID: 18316601
- PMCID: PMC2662716
- DOI: 10.1158/0008-5472.CAN-07-2225
A human breast cell model of preinvasive to invasive transition
Abstract
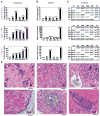
A crucial step in human breast cancer progression is the acquisition of invasiveness. There is a distinct lack of human cell culture models to study the transition from preinvasive to invasive phenotype as it may occur "spontaneously" in vivo. To delineate molecular alterations important for this transition, we isolated human breast epithelial cell lines that showed partial loss of tissue polarity in three-dimensional reconstituted basement membrane cultures. These cells remained noninvasive; however, unlike their nonmalignant counterparts, they exhibited a high propensity to acquire invasiveness through basement membrane in culture. The genomic aberrations and gene expression profiles of the cells in this model showed a high degree of similarity to primary breast tumor profiles. The xenograft tumors formed by the cell lines in three different microenvironments in nude mice displayed metaplastic phenotypes, including squamous and basal characteristics, with invasive cells exhibiting features of higher-grade tumors. To find functionally significant changes in transition from preinvasive to invasive phenotype, we performed attribute profile clustering analysis on the list of genes differentially expressed between preinvasive and invasive cells. We found integral membrane proteins, transcription factors, kinases, transport molecules, and chemokines to be highly represented. In addition, expression of matrix metalloproteinases MMP9, MMP13, MMP15, and MMP17 was up-regulated in the invasive cells. Using small interfering RNA-based approaches, we found these MMPs to be required for the invasive phenotype. This model provides a new tool for dissection of mechanisms by which preinvasive breast cells could acquire invasiveness in a metaplastic context.
Figures


References
-
- Sontag L, Axelrod DE. Evaluation of pathways for progression of heterogeneous breast tumors. J Theor Biol. 2005;232:179–89. - PubMed
-
- Buerger H, Otterbach F, Simon R, et al. Comparative genomic hybridization of ductal carcinoma in situ of the breast-evidence of multiple genetic pathways. J Pathol. 1999;187:396–402. - PubMed
-
- Etzell JE, Devries S, Chew K, et al. Loss of chromosome 16q in lobular carcinoma in situ. Hum Pathol. 2001;32:292–6. - PubMed
-
- Gong G, DeVries S, Chew KL, Cha I, Ljung BM, Waldman FM. Genetic changes in paired atypical and usual ductal hyperplasia of the breast by comparative genomic hybridization. Clin Cancer Res. 2001;7:2410–4. - PubMed
-
- Isola J, Chu L, DeVries S, et al. Genetic alterations in ERBB2-amplified breast carcinomas. Clin Cancer Res. 1999;5:4140–5. - PubMed
Publication types
MeSH terms
Grants and funding
- CA098131/CA/NCI NIH HHS/United States
- U01 ES011044/ES/NIEHS NIH HHS/United States
- R01 CA078731/CA/NCI NIH HHS/United States
- P50 CA098131/CA/NCI NIH HHS/United States
- P50 CA058207/CA/NCI NIH HHS/United States
- CA64786/CA/NCI NIH HHS/United States
- CA78731/CA/NCI NIH HHS/United States
- CA50519/CA/NCI NIH HHS/United States
- R01 CA064786/CA/NCI NIH HHS/United States
- R37 CA064786/CA/NCI NIH HHS/United States
- CA58207/CA/NCI NIH HHS/United States
- CA88858/CA/NCI NIH HHS/United States
- R01 CA088858/CA/NCI NIH HHS/United States
- R37 CA050519/CA/NCI NIH HHS/United States
- P01 AG017242/AG/NIA NIH HHS/United States
- CA80067/CA/NCI NIH HHS/United States
- R01 CA050519/CA/NCI NIH HHS/United States
LinkOut - more resources
Full Text Sources
Other Literature Sources
Medical
Research Materials
Miscellaneous

