

Hyperglycemia enhances coagulation and reduces neutrophil degranulation, whereas hyperinsulinemia inhibits fibrinolysis during human endotoxemia
- PMID: 18316629
- PMCID: PMC2435690
- DOI: 10.1182/blood-2007-11-121723
Hyperglycemia enhances coagulation and reduces neutrophil degranulation, whereas hyperinsulinemia inhibits fibrinolysis during human endotoxemia
Abstract
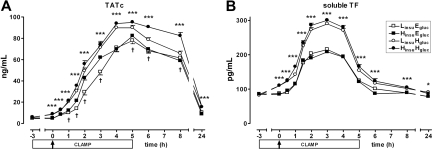
Type 2 diabetes is associated with altered immune and hemostatic responses. We investigated the selective effects of hyperglycemia and hyperinsulinemia on innate immune, coagulation, and fibrinolytic responses during systemic inflammation. Twenty-four healthy humans were studied for 8 hours during clamp experiments in which either plasma glucose, insulin, both, or none was increased, depending on randomization. Target plasma concentrations were 5 versus 12 mM for glucose, and 100 versus 400 pmol/L for insulin. After 3 hours, 4 ng/kg Escherichia coli endotoxin was injected intravenously to induce a systemic inflammatory and procoagulant response. Endotoxin administration induced cytokine release, activation of neutrophils, endothelium and coagulation, and inhibition of fibrinolysis. Hyperglycemia reduced neutrophil degranulation (plasma elastase levels, P < .001) and exaggerated coagulation (plasma concentrations of thrombin-antithrombin complexes and soluble tissue factor, both P < .001). Hyperinsulinemia attenuated fibrinolytic activity due to elevated plasminogen activator-inhibitor-1 levels (P < .001). Endothelial cell activation markers and cytokine concentrations did not differ between clamps. We conclude that in humans with systemic inflammation induced by intravenous endotoxin administration hyperglycemia impairs neutrophil degranulation and potentiates coagulation, whereas hyperinsulinemia inhibits fibrinolysis. These data suggest that type 2 diabetes patients may be especially vulnerable to prothrombotic events during inflammatory states.
Figures


Comment in
-
Glucose, insulin, coagulation: endotoxin as exohormone.Blood. 2008 Jul 1;112(1):6-7. doi: 10.1182/blood-2008-03-145425. Blood. 2008. PMID: 18574036 No abstract available.
References
-
- Carr ME. Diabetes mellitus: a hypercoagulable state. J Diabetes Complications. 2001;15:44–54. - PubMed
-
- Calles-Escandon J, Garcia-Rubi E, Mirza S, Mortensen A. Type 2 diabetes: one disease, multiple cardiovascular risk factors. Coron Artery Dis. 1999;10:23–30. - PubMed
-
- Shah BR, Hux JE. Quantifying the risk of infectious diseases for people with diabetes. Diabetes Care. 2003;26:510–513. - PubMed
-
- Kado S, Nagase T, Nagata N. Circulating levels of interleukin-6, its soluble receptor and interleukin-6/interleukin-6 receptor complexes in patients with type 2 diabetes mellitus. Acta Diabetol. 1999;36:67–72. - PubMed
-
- Pickup JC, Chusney GD, Thomas SM, Burt D. Plasma interleukin-6, tumour necrosis factor alpha and blood cytokine production in type 2 diabetes. Life Sci. 2000;67:291–300. - PubMed
Publication types
MeSH terms
Substances
LinkOut - more resources
Full Text Sources
Medical
