. 2008 Mar 11;105(10):3963-7.
doi: 10.1073/pnas.0709530105. Epub 2008 Mar 3.

Disclosure of the mycobacterial outer membrane: cryo-electron tomography and vitreous sections reveal the lipid bilayer structure

Affiliations

Disclosure of the mycobacterial outer membrane: cryo-electron tomography and vitreous sections reveal the lipid bilayer structure

Christian Hoffmann et al. Proc Natl Acad Sci U S A. .

Abstract

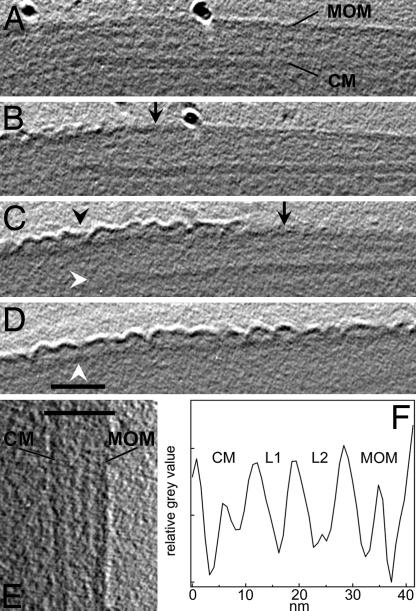
The cell walls of mycobacteria form an exceptional permeability barrier, and they are essential for virulence. They contain extractable lipids and long-chain mycolic acids that are covalently linked to peptidoglycan via an arabinogalactan network. The lipids were thought to form an asymmetrical bilayer of considerable thickness, but this could never be proven directly by microscopy or other means. Cryo-electron tomography of unperturbed or detergent-treated cells of Mycobacterium smegmatis embedded in vitreous ice now reveals the native organization of the cell envelope and its delineation into several distinct layers. The 3D data and the investigation of ultrathin frozen-hydrated cryosections of M. smegmatis, Myobacterium bovis bacillus Calmette-Guérin, and Corynebacterium glutamicum identified the outermost layer as a morphologically symmetrical lipid bilayer. The structure of the mycobacterial outer membrane necessitates considerable revision of the current view of its architecture. Conceivable models are proposed and discussed. These results are crucial for the investigation and understanding of transport processes across the mycobacterial cell wall, and they are of particular medical relevance in the case of pathogenic mycobacteria.


Conflict of interest statement

The authors declare no conflict of interest.

Figures

Fig. 1.
Fig. 1.
CET of M. bovis bacillus Calmette–Guérin (A, B, D), M. smegmatis (E), and E. coli (C). (A) Intact cell rapidly frozen (vitrified) in growth medium and imaged by using low-dose conditions at liquid nitrogen temperature. Black dots represent gold markers. (B–E) Calculated x–y slices extracted from subvolumes of the three-dimensionally reconstructed cells and corresponding density profiles of the cell envelopes. The profiles were calculated by averaging cross-sections of the cell envelopes along the x–y direction in 20 independent slices. A total of 10,000 cross-sections for the mycobacteria and 8,000 for E. coli were aligned by cross-correlation before averaging. The fitted Gaussian profiles in C (dashed curves) indicate the positions of the peptidoglycan (PG) and the outer membrane (OM). (D and E) Subtomograms recorded at nominal −6-μm defocus and reconstructed without noise reduction. CM, cytoplasmic membrane; L1 and L2, periplasmic layers; MOM, mycobacterial outer membrane. (Scale bars: A, 250 nm; B and C, 100 nm; D and E, 50 nm.)
Fig. 2.
Fig. 2.
CET of intact M. smegmatis treated with octyl β-glucoside. (A–D) x–y slices of the tomogram without noise filtering. (A) Region of the apparently intact mycobacterial outer membrane (MOM), cytoplasmic membrane (CM), and periplasmic layers L1 and L2 as marked in F. The prominent black dot represents a gold marker used for alignment purposes. (B–D) Slices of cell wall positions with successively affected MOM (black arrowhead) and dissolved CM (white arrowhead in C) because of treatment with detergent. Black arrows indicate the approximate border between detergent-affected and apparently undisturbed regions of the MOM. (D) The white arrowhead indicates the putative mycolate layer. (Scale bar: 50 nm.) (E) Enlarged slices of the cell envelope illustrating the bilayer structure of the CM and the MOM. The bar indicates the width of the profile displayed in F. The averaged profile was calculated according to the procedure described in the legend of Fig. 1.
Fig. 3.
Fig. 3.
Cryo-electron micrographs of vitreous cryosections from mycobacteria. The sections have a nominal thickness of 35 nm. (A) Cross-section of an M. smegmatis cell deformed by the cutting process. Regions perpendicular to the cutting direction (arrowheads) were used for further analyses. (Scale bar: 200 nm.) (B) Cell envelope of M. smegmatis (subarea from A). (C) Cell envelope of M. bovis bacillus Calmette–Guérin. (Scale bars: 100 nm.) (D and E) Averaged profiles from the cell envelopes of M. smegmatis (D) and M. bovis bacillus Calmette–Guérin (E). CM, cytoplasmic membrane; L1 and L2, domain-rich periplasmic layers; MOM, mycobacterial outer membrane. Note that the distances between the membranes and layers are influenced by the cutting process. The bilayer structure of the CM and the MOM is discernible (B–E). Images are corrected for the contrast transfer function with fitted defocus values of −6.4 μm (B) and −6.7 μm (C).
Fig. 4.
Fig. 4.
Cryo-electron micrographs of vitreous cryosections from C. glutamicum. The sections have a nominal thickness of 35 nm. (A and C) Wild-type cells imaged at high (A) and low (C) defocus. The bilayer structure of the cytoplasmic membrane (CM) and of the outer membrane (OM) is resolved in minimally compressed parts of the cell envelope (arrowheads). (B) Projection of an ultrathin section of the mycolic acid-lacking mutant C. glutamicum Δpks13 at low defocus. (D) Thickness of the cell walls determined from several cells as measured from the surface of the CM to the outer surface of the cell wall. In images of the mutant cell wall, the cell boundary was identified by the change from higher to lower contrast (background). The center of the thickness curves corresponds to the position of the cell envelope “poles” that are oriented perpendicular to the cutting direction. Filled symbols, wild-type cells; open symbols, mutant cells.
Fig. 5.
Fig. 5.
Theoretical models of the mycobacterial outer membrane exhibiting reduced thickness. Lipids in the gel phase are indicated by straight lines, and those in the fluid phase, by zigzags. Open symbols indicate apolar headgroups; filled symbols represent polar headgroups. The covalent bonding of mycolic acids (red) to the arabinogalactan polymer is indicated. The profile of the pore protein corresponds to MspA of M. smegmatis (length: 9.8 nm). The molecular constituents are drawn approximately to scale. (A) The meromycolate of bound mycolic acids spans the hydrocarbon region. (B) The regions of meromycolates not being paired by the α-chain of mycolic acids interact with the inner leaflet and apolar headgroups of extractable lipids. The remaining parts form an additional hydrophobic zone below the outer membrane.

References

    1. Barry CE, III, Lee RE, Mdluli K, Sampson AE, Schroeder BG, Slayden RA, Yuan Y. Prog Lipid Res. 1998;37:143–179. - PubMed
    1. Daffé M, Draper P. Adv Microbial Physiol. 1998;39:131–203. - PubMed
    1. Niederweis M. Mol Microbiol. 2003;49:1167–1177. - PubMed
    1. Brennan PJ, Nikaido H. Annu Rev Biochem. 1995;64:29–63. - PubMed
    1. Minnikin D. In: The Biology of Mycobacteria. Tatledge C, Stanford J, editors. Vol 1. London: Academic; 1982. pp. 94–184.

Publication types

MeSH terms

LinkOut - more resources