

Microbial community gene expression in ocean surface waters
- PMID: 18316740
- PMCID: PMC2268829
- DOI: 10.1073/pnas.0708897105
Microbial community gene expression in ocean surface waters
Abstract
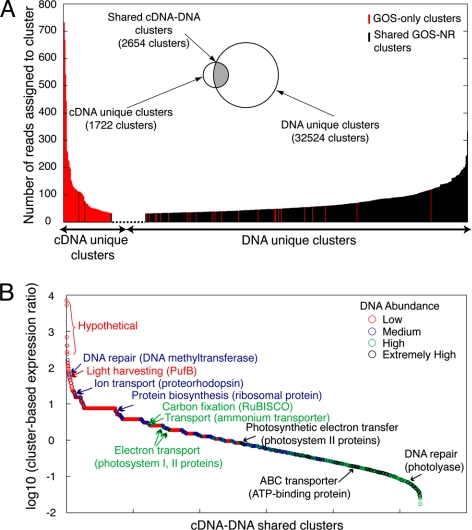
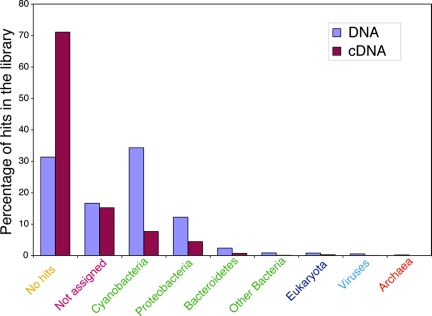
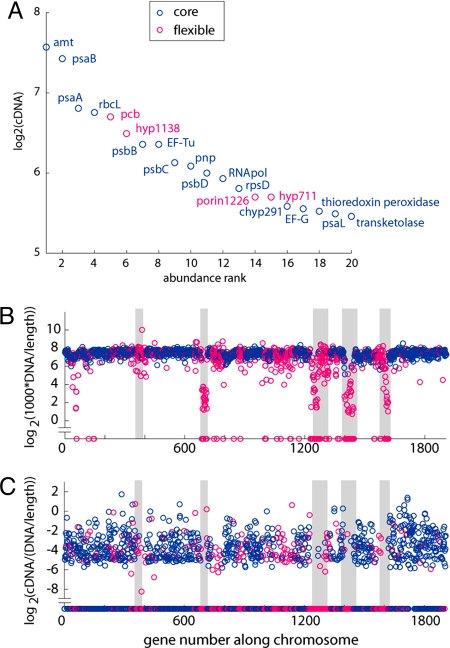
Metagenomics is expanding our knowledge of the gene content, functional significance, and genetic variability in natural microbial communities. Still, there exists limited information concerning the regulation and dynamics of genes in the environment. We report here global analysis of expressed genes in a naturally occurring microbial community. We first adapted RNA amplification technologies to produce large amounts of cDNA from small quantities of total microbial community RNA. The fidelity of the RNA amplification procedure was validated with Prochlorococcus cultures and then applied to a microbial assemblage collected in the oligotrophic Pacific Ocean. Microbial community cDNAs were analyzed by pyrosequencing and compared with microbial community genomic DNA sequences determined from the same sample. Pyrosequencing-based estimates of microbial community gene expression compared favorably to independent assessments of individual gene expression using quantitative PCR. Genes associated with key metabolic pathways in open ocean microbial species-including genes involved in photosynthesis, carbon fixation, and nitrogen acquisition-and a number of genes encoding hypothetical proteins were highly represented in the cDNA pool. Genes present in the variable regions of Prochlorococcus genomes were among the most highly expressed, suggesting these encode proteins central to cellular processes in specific genotypes. Although many transcripts detected were highly similar to genes previously detected in ocean metagenomic surveys, a significant fraction ( approximately 50%) were unique. Thus, microbial community transcriptomic analyses revealed not only indigenous gene- and taxon-specific expression patterns but also gene categories undetected in previous DNA-based metagenomic surveys.
Conflict of interest statement
The authors declare no conflict of interest.
Figures
References
-
- Giovannoni SJ, Stingl U. Molecular diversity and ecology of microbial plankton. Nature. 2005;437:343–348. - PubMed
-
- DeLong EF, Karl DM. Genomic perspectives in microbial oceanography. Nature. 2005;437:336–342. - PubMed
-
- Beja O, Spudich EN, Spudich JL, Leclerc M, DeLong EF. Proteorhodopsin phototrophy in the ocean. Nature. 2001;411:786–789. - PubMed
-
- Tyson GW, et al. Community structure and metabolism through reconstruction of microbial genomes from the environment. Nature. 2004;428:37–43. - PubMed
-
- DeLong EF, et al. Community genomics among stratified microbial assemblages in the ocean's interior. Science. 2006;311:496–503. - PubMed
Publication types
MeSH terms
Substances
LinkOut - more resources
Full Text Sources
Other Literature Sources
