

doi: 10.1155/2007/83416.
Clustering approach to quantify long-term spatio-temporal interactions in epileptic intracranial electroencephalography
Affiliations
- PMID: 18317515
- PMCID: PMC2248704
- DOI: 10.1155/2007/83416
Item in Clipboard
Clustering approach to quantify long-term spatio-temporal interactions in epileptic intracranial electroencephalography
Comput Intell Neurosci.
2007.
Abstract
Abnormal dynamical coupling between brain structures is believed to be primarily responsible for the generation of epileptic seizures and their propagation. In this study, we attempt to identify the spatio-temporal interactions of an epileptic brain using a previously proposed nonlinear dependency measure. Using a clustering model, we determine the average spatial mappings in an epileptic brain at different stages of a complex partial seizure. Results involving 8 seizures from 2 epileptic patients suggest that there may be a fixed pattern associated with regional spatio-temporal dynamics during the interictal to pre-post-ictal transition.
Figures
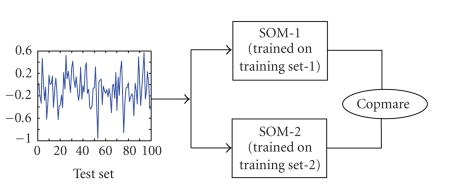
Experimental setup to compare SOM-Similarity Indices
obtained from two (2) separate maps.

Comparing interdependencies between
channels LOF3 and LOF4. Left: SOM-similarity profiles from the output of SOM-1
and SOM-2 are superimposed. Right: Histogram of the errors in %. Top: Seizure 4
and 5. Middle: Seizure 6 and 7. Bottom: Seizure 11.
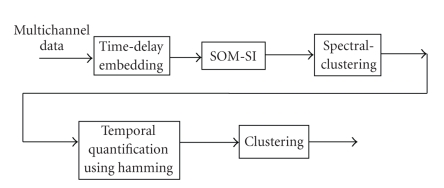
Block diagram to extract spatio-temporal
groupings information in Multivariate EEG structures.

Diagram of the depth and subdural electrode montage in an epileptic
brain. Electrode strips are placed over the left orbitofrontal (LOF), right
orbitofrontal (ROF), left subtemporal (LST), right subtemporal cortex (RST).
Depth electrodes are placed on the left temporal depth (LTD) and right temporal
depth (RTD), to record hippocampus EEG activity.

Seizure 11 of patient P093: Number in bracket indicates the 30-minute time interval when the cluster-similarity matrices were computed. The cluster-similarity matrices represent the probability that two channels share the same cluster label in a 30-minute time interval.

Dendrogram representation of the cluster results in Seizure 11, P093. TOP: Dendrogram corresponding to 2.5 hours before seizure. BOTTOM: Dendrogram corresponding to the 30-minute preseizure period.

Statistical validation of the clustering results. In each panel, thick lines are used to represent the profiles of the three clusters in a 30-minute time interval. The thin lines are the surrogate profiles indicating between-cluster interactions. Cluster veracity can be visually verified by observing that amplitudes representing within-cluster interaction for cluster profiles are mostly higher that the amplitudes representing between-cluster interaction for surrogate profiles, at each time instance.

Seizures 4 and 5 of patient P093. Number in bracket indicates the 30-minute time interval when the cluster-similarity matrices were computed. The cluster-similarity matrices represent the probability that two channels share the same cluster label in a 30-minute time interval.

Seizures 6 and 7 of patient P093: Number in bracket indicates the 30-minute time interval when the cluster-similarity matrices were computed. The cluster-similarity matrices represent the probability that two channels share the same cluster label in a 30-minute time interval.

Dendrograms corresponding to P092, Seizure 1. Top: 2 hours before Seizure. Bottom: 30-minute preseizure.

Seizure 1 of patient P092 Number in bracket indicates the 30-minute time interval when the cluster-similarity matrices were computed. The cluster-similarity matrices represent the probability that two channels share the same cluster label in a 30-minute time interval.
References
-
- Iasemidis LD, Principe JC, Czaplewski JM, Gilman RL, Roper SN, Sackellares JC. Spatiotemporal transition to epileptic seizures: a nonlinear dynamical analysis of scalp and intracranial EEG recordings. In: Lopes da Silva FH, Principe JC, Almeida LB, editors. Spatiotemporal Models in Biological and Artificial Systems. Amsterdam, The Netherlands: IOS Press; 1997. pp. 81–89.
-
- Iasemidis LD, Olson LD, Sackellares JC, Savit RS. Time dependencies in the occurrences of epileptic seizures. Epilepsy Research. 1994;17(1):81–94. - PubMed
-
- Blinowska KJ, Kuś R, Kamiński M. Granger causality and information flow in multivariate processes. Physical Review E. 2004;70(5):4 pages.050902 - PubMed
-
- Arnhold J, Grassberger P, Lehnertz K, Elger CE. A robust method for detecting interdependences: application to intracranially recorded EEG. Physica D. 1999;134(4):419–430.
-
- Hegde A, Erdogmus D, Rao YN, Principe JC, Gao JB. SOM-based similarity index measure: quantifying interactions between multivariate structures. In: Proceedings of the 13th IEEE Workshop on Neural Networks for Signal Processing (NNSP '03); 2003; Toulouse, France. Sep, pp. 819–828.
LinkOut - more resources
Full Text Sources
