. 2008 Apr;118(4):1450-7.
doi: 10.1172/JCI34022.

In vivo time-lapse microscopy reveals no loss of murine myonuclei during weeks of muscle atrophy

Affiliations

In vivo time-lapse microscopy reveals no loss of murine myonuclei during weeks of muscle atrophy

Jo C Bruusgaard et al. J Clin Invest. 2008 Apr.

Abstract

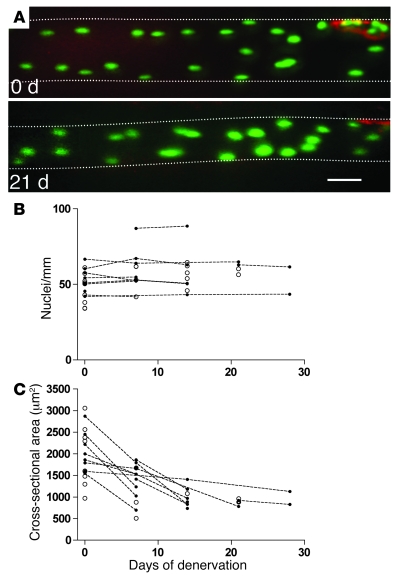
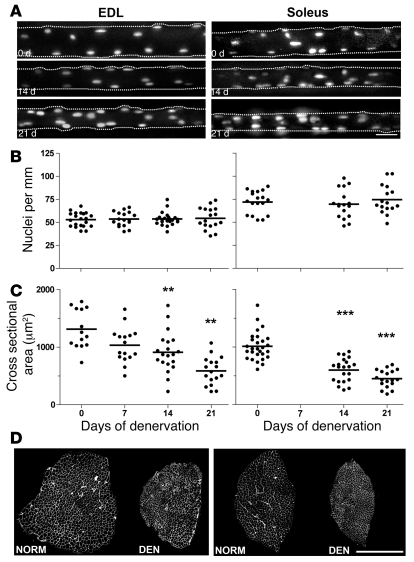
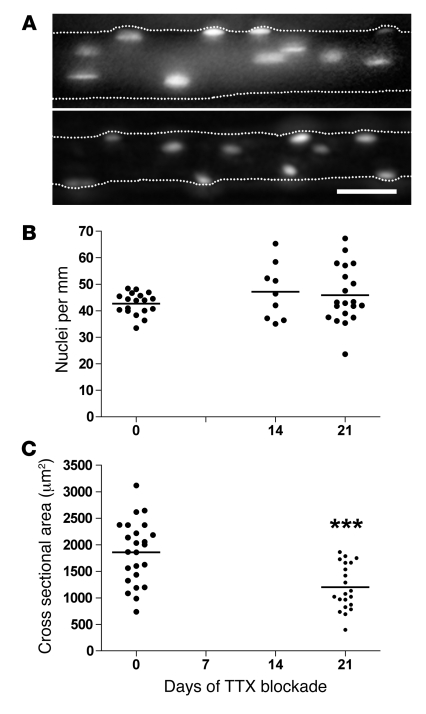
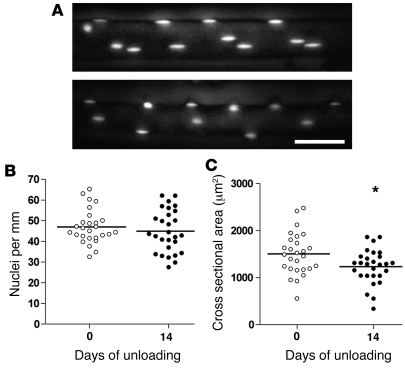
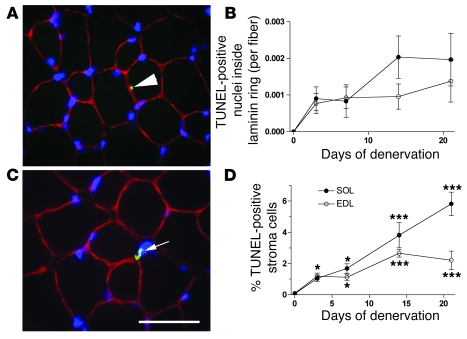
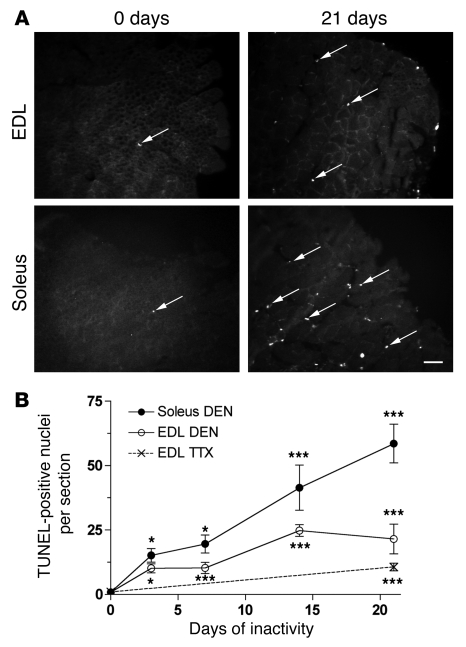
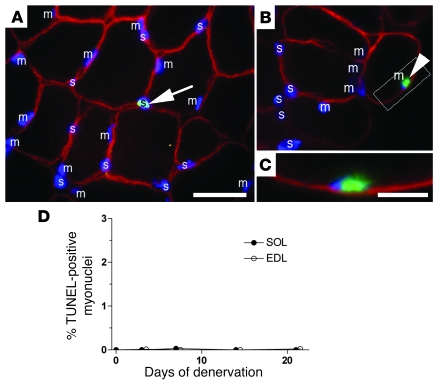
Numerous studies have suggested that muscle atrophy is accompanied by apoptotic loss of myonuclei and therefore recovery would require replenishment by muscle stem cells. We used in vivo time-lapse microscopy to observe the loss and replenishment of myonuclei in murine muscle fibers following induced muscle atrophy. To our surprise, imaging of single fibers for up to 28 days did not support the concept of nuclear loss during atrophy. Muscles were inactivated by denervation, nerve impulse block, or mechanical unloading. Nuclei were stained in vivo either acutely by intracellular injection of fluorescent oligonucleotides or in time-lapse studies after transfection with a plasmid encoding GFP with a nuclear localization signal. We observed no loss of myonuclei in fast- or slow-twitch muscle fibers despite a greater than 50% reduction in fiber cross-sectional area. TUNEL labeling of fragmented DNA on histological sections revealed high levels of apoptotic nuclei in inactive muscles. However, when costained for laminin and dystrophin, virtually none of the TUNEL-positive nuclei could be classified as myonuclei; apoptosis was confined to stromal and satellite cells. We conclude that disuse atrophy is not a degenerative process, but is rather a change in the balance between protein synthesis and proteolysis in a permanent cell syncytium.


Figures

Figure 1
Figure 1. Time-lapse study of nuclei and atrophy in single muscle fibers in the EDL muscle after denervation.
(A) Images of a representative muscle fiber after injection of an expression vector encoding nucEGFP (green) showing the same fiber observed at the time of denervation and again after 21 days. The neuromuscular endplate was stained by α-bungarotoxin (red). At both time points, 21 nuclei can be identified within the picture frame. Background staining of EGFP or fluorescent nucleotides in the cytosol made the fiber outline discernible, and an estimated cross-sectional area was calculated from the apparent diameter. The fiber boundaries are outlined for clarity. For the 2-dimensional illustrations presented in the figures, the image stacks were merged by the Project Z command in NIH ImageJ. Some out-of-focus information was removed from some of the planes, and different degrees of contrast enhancement were used in different parts of the final image to compensate for spatial differences in camera sensitivity and in staining intensity due to variable diffusion distances from the point of injection. Scale bar: 50 μm. (B) Summary of nuclei counts performed on picture stacks of fiber segments. Data representing multiple observations from the same fiber are indicated by filled symbols connected with broken lines. Single time-point observations of other fibers are indicated with open symbols. (C) For the same fibers as shown in B, cross-sectional area (CSA) was estimated by measuring the fiber diameter on micrographs.
Figure 2
Figure 2. The effect of denervation on nuclei number and atrophy of single muscle fibers studied by acute in vivo staining and imaging in live animals.
Fluorescent oligonucleotides were injected into single fibers in the EDL (left panels) and soleus (right panels) muscles at 0–21 days after denervation. (A) Images of representative single muscle fibers. See legend of Figure 1 for details about image processing for the 2-dimensional illustrations. Scale bar: 25 μm. The number of nuclei (B) and the cross-sectional area (C) were calculated from the image stacks. Horizontal lines indicate means; asterisks indicate statistical differences from normal values (**P < 0.01; ***P < 0.001). (D) The degree of atrophy after 21 days of denervation is illustrated by laminin-stained cryosections in. Scale bar: 500 μm.
Figure 3
Figure 3. The effect of blocking nerve-evoked impulse activity on nuclei number and atrophy of single muscle fibers studied by acute in vivo staining and imaging in live animals.
Fluorescent oligonucleotides were injected into single muscle fibers in EDL muscles at 0–21 days after starting a TTX block. (A) Representative images of single fibers. See legend of Figure 1 for details about image processing for the 2-dimensional illustrations. The number of nuclei (B) and the cross-sectional area (C) were calculated from image stacks. Horizontal lines indicate means; asterisks indicate statistical differences from normal values (***P < 0.001); scale bar: 25 μm.
Figure 4
Figure 4. The effect of unloading on nuclei number and atrophy of single muscle fibers studied by acute in vivo staining and imaging in live animals.
Fluorescent oligonucleotides were injected into single muscle fibers in EDL muscles at 0 and 14 days after unloading. (A) Representative images of single fibers. See legend of Figure 1 for details about image processing for the 2-dimensional illustrations. The number of nuclei (B) and the cross-sectional area (C) were calculated from image stacks. Horizontal lines indicate means; asterisk indicates statistical differences from normal values (*P = 0.03); scale bar: 25 μm.
Figure 7
Figure 7. Apoptosis of satellite and stromal cells.
Sections were triple stained with antibodies against laminin (red), TUNEL (green), and Hoechst dye 33342 (blue). TUNEL-stained nuclei inside the laminin ring were regarded as apoptotic satellite cells (arrow in A), since virtually no myonuclei were apoptotic (Figure 6). The number of such cells at various times after denervation is shown in B. Kruskal-Wallis test indicated that the increase after denervation was significant in both the EDL and the soleus, but since all sections in normal muscles and several sections from denervated muscles displayed 0-values for TUNEL-positive cells inside the laminin ring, post-testing for each time point was precluded. An example of a TUNEL-stained cell nucleus (arrow) outside the basal lamina indicative of an apoptotic stromal cell is shown in C, and the number of such cells at various times after denervation is shown in D. Asterisks indicate statistical differences from normal values (*P < 0.05; ***P < 0.001). Scale bar: 25 μm. Means ± SEM; n = 6–10 sections.
Figure 8
Figure 8. Quantification from cryosections stained for dystrophin of number of myonuclei (A), number of muscle fibers (B), and fiber cross-sectional area (B) after denervation.
Means ± SEM of 5–6 muscles at each time point. ***P < 0.001.
Figure 5
Figure 5. Apoptosis in normal and inactive muscles.
(A) Representative images of TUNEL-stained cryosections from normal EDL and soleus muscles and 21 days after denervation of the muscles. Arrows indicate examples of apoptotic nuclei. (B) Counts (means ± SEM) from 6–10 sections from muscles that were denervated or TTX blocked for 0–21 days. Asterisks indicate statistical differences from normal values (*P < 0.05; ***P < 0.01). Scale bar: 25 μm.
Figure 6
Figure 6. Apoptosis in nuclei identified as myonuclei was extremely rare.
(AC) Sections triple-stained with antibodies against dystrophin (red), TUNEL (green), and Hoechst dye 33342 (blue). Myonuclei (m) or nuclei that are either satellite or stromal cells (s) are indicated. A TUNEL-positive nucleus outside the dystrophin staining, i.e., a stromal or satellite cell, is indicated in A (arrow). Scale bar: 25 μm. One of the only 4 apoptotic nuclei in the present study that appeared to be a myonucleus is illustrated at the same magnification in B (arrowhead), with the framed area at higher magnification shown in C (scale bar: 10 μm). (D) Percentage of TUNEL-positive myonuclei after denervation. The symbols for EDL were shifted slightly sideways for clarity. Means ± SEM; n = 6–10 sections.

References

    1. Gundersen K. Determination of muscle contractile properties: The importance of the nerve. Acta Physiol. Scand. 1998;162:333–341. doi: 10.1046/j.1365-201X.1998.0336e.x. - DOI - PubMed
    1. Glass D.J. Signalling pathways that mediate skeletal muscle hypertrophy and atrophy. Nat. Cell Biol. 2003;5:87–90. doi: 10.1038/ncb0203-87. - DOI - PubMed
    1. Glass D.J. Skeletal muscle hypertrophy and atrophy signaling pathways. Int. J. Biochem. Cell Biol. 2005;37:1974–1984. - PubMed
    1. Jackman R.W., Kandarian S.C. The molecular basis of skeletal muscle atrophy. Am. J. Physiol. Cell Physiol. 2004;287:C834–C843. doi: 10.1152/ajpcell.00579.2003. - DOI - PubMed
    1. Allen D.L., et al. Myonuclear number and myosin heavy chain expression in rat soleus single muscle fibers after spaceflight. J. Appl. Physiol. 1996;81:145–151. - PubMed

Publication types