. 2008 Mar 4;5(3):e41.
doi: 10.1371/journal.pmed.0050041.

An antibiotic-responsive mouse model of fulminant ulcerative colitis

Affiliations

An antibiotic-responsive mouse model of fulminant ulcerative colitis

Silvia S Kang et al. PLoS Med. .

Abstract

Background: The constellation of human inflammatory bowel disease (IBD) includes ulcerative colitis and Crohn's disease, which both display a wide spectrum in the severity of pathology. One theory is that multiple genetic hits to the host immune system may contribute to the susceptibility and severity of IBD. However, experimental proof of this concept is still lacking. Several genetic mouse models that each recapitulate some aspects of human IBD have utilized a single gene defect to induce colitis. However, none have produced pathology clearly distinguishable as either ulcerative colitis or Crohn's disease, in part because none of them reproduce the most severe forms of disease that are observed in human patients. This lack of severe IBD models has posed a challenge for research into pathogenic mechanisms and development of new treatments. We hypothesized that multiple genetic hits to the regulatory machinery that normally inhibits immune activation in the intestine would generate more severe, reproducible pathology that would mimic either ulcerative colitis or Crohn's disease.

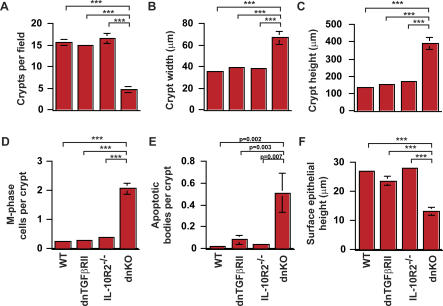
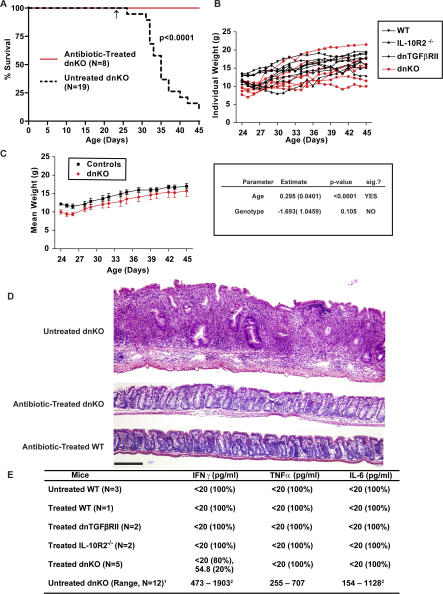
Methods and findings: We generated a novel mouse line (dnKO) that possessed defects in both TGFbetaRII and IL-10R2 signaling. These mice rapidly and reproducibly developed a disease resembling fulminant human ulcerative colitis that was quite distinct from the much longer and more variable course of pathology observed previously in mice possessing only single defects. Pathogenesis was driven by uncontrolled production of proinflammatory cytokines resulting in large part from T cell activation. The disease process could be significantly ameliorated by administration of antibodies against IFNgamma and TNFalpha and was completely inhibited by a combination of broad-spectrum antibiotics.

Conclusions: Here, we develop to our knowledge the first mouse model of fulminant ulcerative colitis by combining multiple genetic hits in immune regulation and demonstrate that the resulting disease is sensitive to both anticytokine therapy and broad-spectrum antibiotics. These findings indicated the IL-10 and TGFbeta pathways synergize to inhibit microbially induced production of proinflammatory cytokines, including IFNgamma and TNFalpha, which are known to play a role in the pathogenesis of human ulcerative colitis. Our findings also provide evidence that broad-spectrum antibiotics may have an application in the treatment of patients with ulcerative colitis. This model system will be useful in the future to explore the microbial factors that induce immune activation and characterize how these interactions produce disease.


Conflict of interest statement

Competing Interests: The authors have declared that no competing interests exist.

Figures

Figure 1
Figure 1. dnKO Mice Fail to Thrive and Waste Rapidly Because of a Fatal, 100% Penetrant Disease Process Localized to the Cecum and Colon
(A) Plot of the average weight/group versus time for WT (n = 4), dnTGFβRII (n = 4), IL-10R2−/− (n = 5), and dnKO (n = 11) mice. All mice were weighed two or three times per week from 3 to 18 wk of age. Error bars were omitted for the sake of clarity. In all cases the experimental error was ≤ 8% of the mean value. Individual mice died or were humanely killed when their weight reached ≤ 70% of their maximal weight. The line representing dnKO average weight terminates with the death of the final dnKO mouse. (B) Whole-mount images of the mucosal surface of the descending colon from 4- to 5-wk-old WT, dnTGFβRII, IL-10R2−/−, and dnKO mice. The cecum and entire colons were harvested, dissected, opened, pinned in Bouin's fixative, and examined for gross morphology. The dnKO mice all contained major pathologic alterations including severe ulceration (e.g., red arrow) and mucosal thickening in the cecum, descending colon, and rectum (**), as well as minor alterations (*) in the ascending colon.
Figure 2
Figure 2. dnKO Mice Develop Diffuse Fulminant Ulcerative Colitis That Is Not Detected in Age-matched Controls
Colons from WT, dnTGFβRII, IL-10R2−/−, and dnKO mice were isolated at 4–5 wk of age as in Figure 1. Images from HE stained sections of rectums from (A) WT, (B) dnTGFβRII, (C) IL-10R2−/−, and (D) dnKO mice are shown at low power (100×). One higher power image (400×) is shown for (A–C, right images) and four higher-power images (I–IV) for (D). The boxed region on the lower power image indicates the location of the higher magnification(s). The four highlighted regions in the dnKO image (D) reflect (I) epithelial hyperplasia, presence of increased M-phase cells, and goblet cell loss in crypts; (II) eroded surface epithelium; (III) mucosal and submucosal leukocytic inflammation; and (IV) the presence of a crypt abscess. Bars, 200 μm for 100× images and 30 μm for 400× images.
Figure 3
Figure 3. dnKO Histopathology Shares Features of Inflammation Detected in Human Ulcerative Colitis
Objective, quantitative morphometric analysis of the rectal histopathology was conducted on 4–5-wk-old WT, dnTGFβRII, IL-10R2−/−, and dnKO mice. (A–D) Using well-oriented sections, we measured crypt loss/drop out by examining (A) the number of crypts per field (a field, 870 μm) and (B) crypt width. Epithelial hyperplasia was assayed by measuring (C) crypt height (from the base of the crypt to the basal side of the surface epithelial cells) and (D) the ratio of M-phase cells/crypt. (E) The ratio of apoptotic bodies/crypt and (F) surface epithelial heights were quantified to determine effects on cell death and barrier epithelial changes. All measurements are the averages ± SEM from n = 5–8 mice per group. The F test results are (A) F(3,23) = 26.74, p < 0.0001; (B) F(3,23) = 21.17, p < 0.0001; (C) F(3,23) = 53.53, p < 0.0001; (D) F(3,25) = 89.47, p < 0.0001; (E) F(3,24) = 7.574, p = 0.001; (F) F(3,23) = 41.35, p < 0.0001. Where F testing revealed statistically significant differences within groups (p < 0.05), individual means were compared by Bonferroni's multiple comparison test. All statistically significant comparisons (p < 0.05) between any two groups were indicated with a bracket. The exact p-value is listed unless p < 0.001 (indicated by ***).
Figure 4
Figure 4. Diseased dnKO Mice Have Diverse Leukocytic Infiltrates Located in the Cecum and Colon
Lamina propria/MALT cells from the pooled cecum, descending colon, and rectum were isolated from 4–5-wk-old WT, dnTGFβRII, IL-10R2−/−, and dnKO mice. Shown are the averages ±SEM for the total number of CD45.2+ (hematopoietic) cells located within the tissue as well as for each subset of CD45.2+ cells stained for T cells (CD4+ or CD8+), immature myeloid/monocytes (CD11b+Gr1lo), neutrophils (CD11b+Gr1hi), NK/NKT (DX5+), and B cells (B220+) from seven separate experiments with n = 6–15 mice per group. Results were consistent with observations using immunofluorescence microscopy (not shown). The F test results are: total immune cells, F(3,32) = 69.76, p < 0.0001; CD4+ T cells, F(3,32) = 23.16, p < 0.0001; CD8+ T cells, F(3,32) = 9.779, p < 0.0001; monocytes/immature myeloid cells, F(3,16) = 11.57, p = 0.0003; neutrophils, F(3,16) = 16.59, p < 0.0001; NK/NKT cells, F(3,16) = 10.93, p = 0.0005; B cells, F(3,27) = 27.47, p < 0.0001. All statistically significant comparisons (p < 0.05) between any two groups are indicated with a bracket. The exact p-value is listed unless p < 0.001 (indicated by ***).
Figure 5
Figure 5. Colitis in dnKO Mice Is Associated with Elevated Proinflammatory Cytokine Levels and Increased T Cell Activation
(A) Plot of average serum concentrations of IFNγ, TNFα, and IL-6 of 4–5-wk-old WT, dnTGFβRII, IL-10R2−/−, and dnKO mice. Shown are the average ± SEM from n = 10–12 mice/group. The F test results are: INFγ, F(3,38) = 11.73, p < 0.0001; TNFα, F(3,38) = 48.32, p < 0.0001; IL-6, F(3,38) = 18.41, p < 0.0001. Brackets denote all statistically significant differences between two groups; ***p ≤ 0.0001 as described in Materials and Methods. (B) A representative example of CD62L versus CD44 profile of CD4+ T cells from the mesenteric (draining) lymph nodes depicting decreased percentages of naive (CD62LhiCD44lo) cells accompanied by increased percentages of effector/memory cells (CD62LloCD44hi) in dnKO mice compared to controls. Similar results were observed in five to seven separate experiments from n = 6–12 mice/group. (C and D) The percentages of CD4+ IFNγ+ or IL-17+ cells were determined in the (C) mesenteric (draining) lymph nodes and (D) lamina propria/MALT of 4–5-wk-old mice WT, dnTGFβRII, IL-10R2−/−, and dnKO mice. Shown is the average ± SEM from n = 6–11 mice per group. The F test results are: mesenteric lymph node INFγ, F(3,33) = 37.52, p < 0.0001; mesenteric lymph node IL-17, F(3,33) = 21.16, p < 0.0001; lamina propria INFγ, F(3,23) = 20.34, p < 0.0001; lamina propria IL-17, F(3,23) = 7.119, p < 0.0001. All statistically significant comparisons (p < 0.05) between any two groups are indicated with a bracket. The exact p-value is listed unless p < 0.001 (indicated by ***).
Figure 6
Figure 6. Transferred CD4+ T Cells from dnKO Mice Induce Fulminant Ulcerative Colitis in RAG1−/− Mice
CD4+ T cells were purified from ∼3-wk-old WT, dnTGFβRII, IL-10R2−/−, and dnKO mice and 2 × 10⁶ cells were transferred IP into B6.RAG1−/− hosts. (A) Weights were recorded for mice that had received CD4+ T cells from WT (black, n = 4), dnTGFβRII (blue, n = 6), IL-10R2−/− (green, n = 6), or dnKO (red, n = 6) mice. Shown for each group is the percent initial weight of individual mice from three separate experiments. The upward arrow indicates individual mice that were humanely killed for analysis when their weight reached ≤ 80% of their maximal weight (dashed lines). Analysis using the Kaplan-Meier method showed the difference between groups of mice reaching this endpoint of weight loss was statistically significant (p < 0.001, df = 3, log-rank test). (B) Whole mount photographs of the cecum, ascending colon, descending colon, and rectum were scored in a blinded fashion on a 0–3 scale. 0, normal; 1, focal ulcers present; 2, ulcers and diffuse, mild mucosal thickening; and 3, ulcers and diffuse, severe mucosal thickening. The bars represent the average whole-mount score, with each circle representing an individual mouse described in (A). The F test results are: cecum, F(3,18) = 8.07, p = 0.0013; ascending colon, F(3,18) = 17.93, p < 0.0001; descending colon, F(3,18) = 7.720, p = 0.0016; rectum, F(3,18) = 14.39, p < 0.0001. All statistically significant differences (using Bonferroni's multiple comparison test; p < 0.05) between any two groups were indicated with a bracket. The exact p-value is listed unless p < 0.001 (indicated by ***). Scores for recipients receiving dnKO CD4+ T cells were significantly higher than those receiving either WT or dnTGFβRII CD4+ T cells in the ascending colon, descending colon, and rectum. (C) The height and width of the crypts in the descending colon and rectum of HE stained tissue samples were analyzed to measure epithelial hyperplasia and crypt drop out of the mice described in (A). The bar graphs represent the average crypt height or width ± SEM in the descending colon or rectum from B6RAG1−/− mice that received CD4+ T cells from the indicated donors. The F test results are: DC crypt width, F(3,18) = 5.061, p = 0.0102; DC crypt height, F(3,18) = 20.23, p < 0.0001; rectum crypt width, F(3,18) = 13.82, p < 0.0001; rectum crypt height, F(3,18) = 23.58, p < 0.0001. All statistically significant differences (using Bonferroni's multiple comparison test; p < 0.05) between any two groups are indicated with a bracket. The exact p-value is listed unless p < 0.001 (indicated by ***). Mice that received dnKO CD4+ T cells had statistically significant increases in crypt height in the descending colon and rectum compared to all controls and wider crypts in the rectum compared to all controls. Significant increases in the width of descending colon crypts in recipients receiving dnKO CD4+ T cells as compared to recipients receiving WT or dnTGFβRII were also observed.
Figure 7
Figure 7. Amelioration of Colitis in dnKO Mice Through Simultaneous Neutralization of IFNγ and TNFα
(A) HE-stained sections of the rectums of dnKO mice treated with neutralizing antibodies to inflammatory cytokines. Colons from dnKO mice injected IP with 1 mg of neutralizing antibodies against IFNγ, TNFα, IFNγ + TNFα, or an isotype control (anti-PIP) at 2 and 3 wk of age were harvested at 4 wk of age. (B–F) Quantitative morphometric analysis of the histopathology from dnKO mice treated with anti-PIP (isotype control), anti-IFNγ, anti-TNFα, or a combination of anti-IFNγ and anti-TNFα is shown. Crypt loss/dropout was measured by examining (B) the number of crypts per field (a field, 870 μm) and (C) crypt width. Epithelial proliferation was measured by (D) crypt height taken from the base of the crypt to the basal side of the surface epithelial cells. (E and F) The ratio of goblet cells/epithelial cells per crypt (E) and surface epithelial heights (F) were quantified to examine goblet cell loss and barrier changes. Shown for all measurements are the averages ± SEM from n = 5 mice per group. The F test results are (B) F(3,17) = 7.627, p = 0.0019; (C) F(3,17) = 7.467, p = 0.0021; (D) F(3,17) = 4.326, p = 0.0194; (E) F(3,17) = 11.45, p = 0.0002; and (F) F(3,17) = 3.664, p = 0.0334. All statistically significant differences (using Bonferroni's multiple comparison test; p < 0.05) between any two groups were indicated with a bracket. The exact p-value is listed unless p < 0.001 (indicated by ***).
Figure 8
Figure 8. Inhibition of Colitis in dnKO Mice by Broad-spectrum Antibiotic Treatment
(A) 45-d survival of untreated dnKO mice (n = 19; 45-d survival = 10.5%; median survival = 35 d) and dnKO mice receiving metronidazole and ciprofloxacin in drinking water (n = 8; 45-d survival = 100%). Individual mice died or were humanely killed when their weight reached ≤ 70% of maximal weight. Survival was analyzed by the Kaplan-Meier method, and statistical significance of difference between groups is p < 0.0001, by log-rank test. Upward arrow, antibiotic treatment begun at age 24 d. (B and C) Weight gain of antibiotic-treated mice (n = 2 WT, n = 3 IL-10R−/−, n = 4 dnTGFβRII, and n = 7 dnKO) plotted individually (B) or as mean weights (C) of treated dnKO mice (n = 7) and treated controls (n = 9; WT, IL-10R−/−, and dnTGFβRII combined) ± SEM. Data were pooled from three separate experiments using dnKO and littermate controls. To account for the longitudinal nature of the data, analysis of weight change over the course of treatment was performed using generalized estimating equations. The mice gained weight over the course of the experiment (p < 0.001), and the dnKO and control groups did not differ significantly (p = 0.105). (D) Representative images of HE stained sections of rectums from an untreated dnKO mouse humanely killed at ≥ 4 wk, an antibiotic-treated dnKO mouse, and an antibiotic-treated WT mice killed at 45 d of age are shown at low power (bars in [C–E], 200 μm). (E) Serum concentrations of IFNγ, TNFα, and IL-6 in individual untreated WT (n = 3) mice and antibiotic-treated WT (n = 1), dnTGFβRII (n = 2), IL-10R−/− (n = 2), and dnKO (n = 5) mice measured at 5–6 wk. All concentrations were below the limit of detection (<20 pg/ml) except for low levels of IFNγ in one antibiotic-treated dnKO mouse (54.8 pg/ml). 1Ranges of cytokine concentrations from the experiment depicted in Figure 5A are shown for comparison. 2Indicates exclusion of outlier values: one mouse had 4,493 pg/ml IFNγ, and one had 75 pg/ml IL-6.

Comment in

  • You see UC: an animal model of ulcerative colitis.
    Nguyen H, Dalmasso G, Merlin D, Sitaraman SV. Nguyen H, et al. Gastroenterology. 2008 Dec;135(6):2149-50. doi: 10.1053/j.gastro.2008.10.062. Epub 2008 Nov 8. Gastroenterology. 2008. PMID: 19000681 No abstract available.

Similar articles

Cited by

References

    1. Xavier RJ, Podolsky DK. Unravelling the pathogenesis of inflammatory bowel disease. Nature. 2007;448:427–434. - PubMed
    1. Elson CO, Cong Y, McCracken VJ, Dimmitt RA, Lorenz RG, et al. Experimental models of inflammatory bowel disease reveal innate, adaptive, and regulatory mechanisms of host dialogue with the microbiota. Immunol Rev. 2005;206:260–276. - PubMed
    1. Sadlack B, Merz H, Schorle H, Schimpl A, Feller AC, et al. Ulcerative colitis-like disease in mice with a disrupted interleukin-2 gene. Cell. 1993;75:253–261. - PubMed
    1. Rudolph U, Finegold MJ, Rich SS, Harriman GR, Srinivasan Y, et al. Ulcerative colitis and adenocarcinoma of the colon in G alpha i2-deficient mice. Nat Genet. 1995;10:143–150. - PubMed
    1. Mombaerts P, Clarke AR, Rudnicki MA, Iacomini J, Itohara S, et al. Mutations in T-cell antigen receptor genes alpha and beta block thymocyte development at different stages. Nature. 1992;360:225–231. - PubMed

Publication types

MeSH terms

Substances