. 2008 Jan 4;8(1):1.1-20.
doi: 10.1167/8.1.1.

Face adaptation does not improve performance on search or discrimination tasks

Affiliations

Face adaptation does not improve performance on search or discrimination tasks

Minna Ng et al. J Vis. .

Abstract

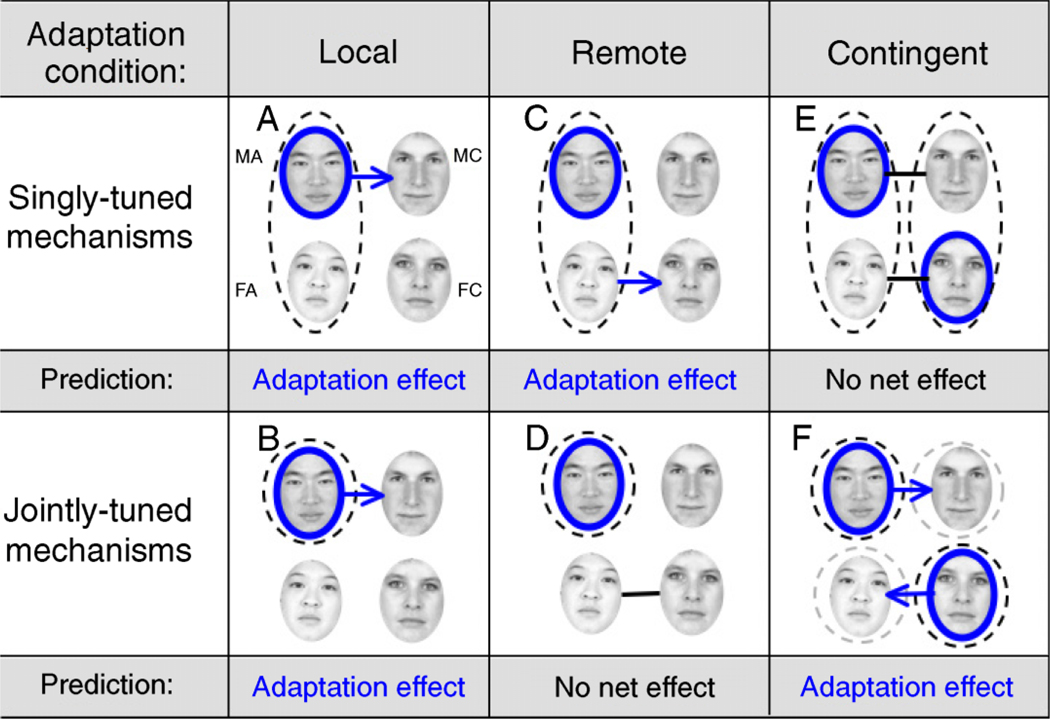
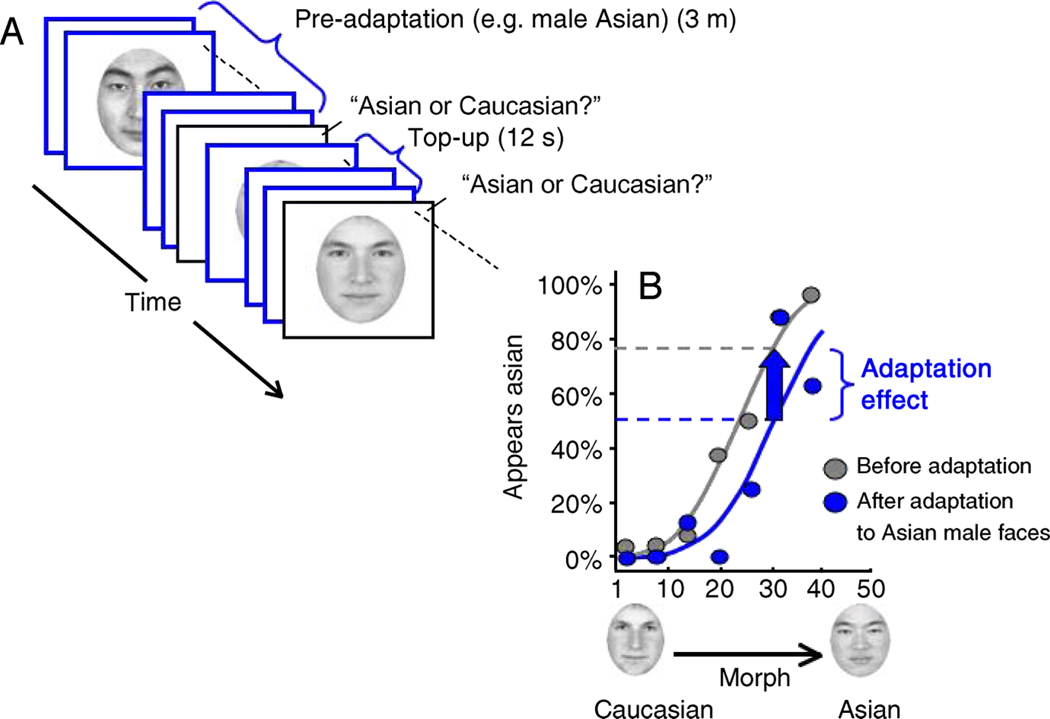
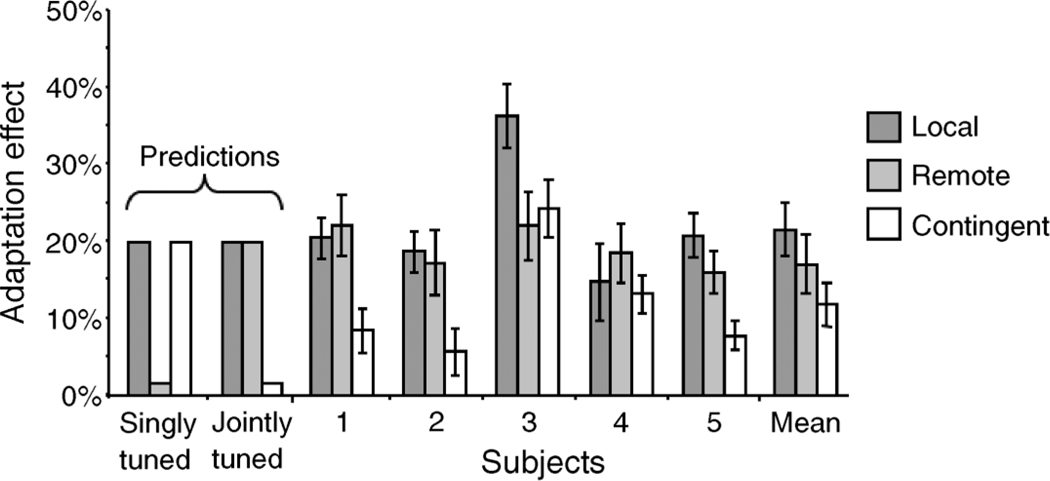
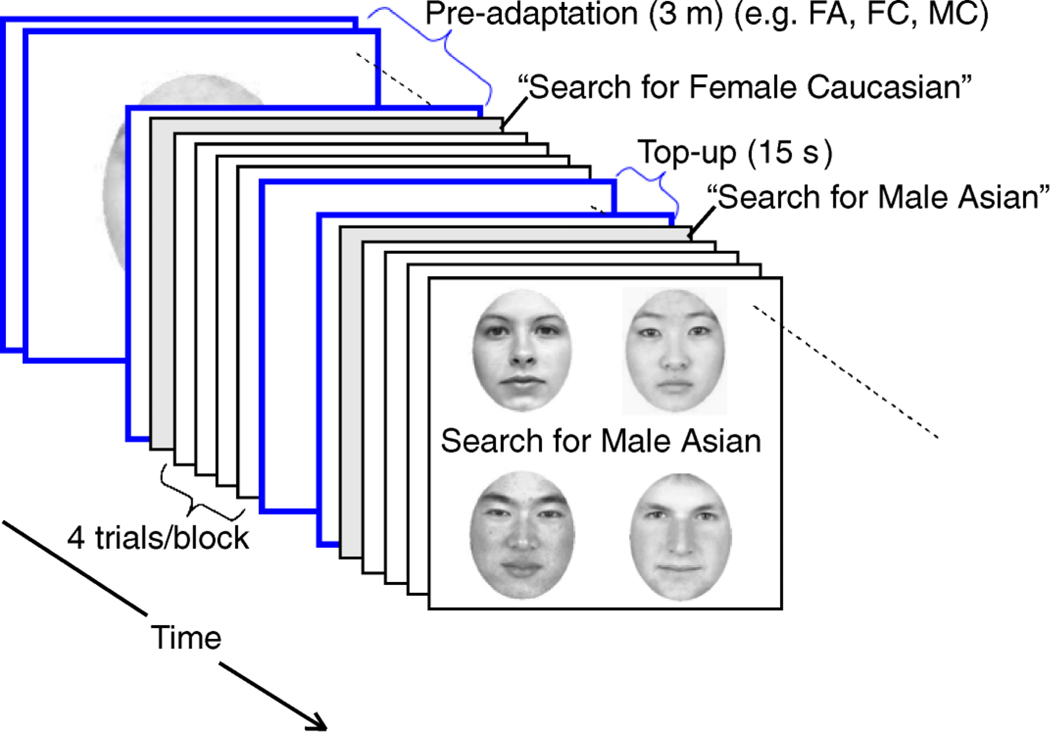
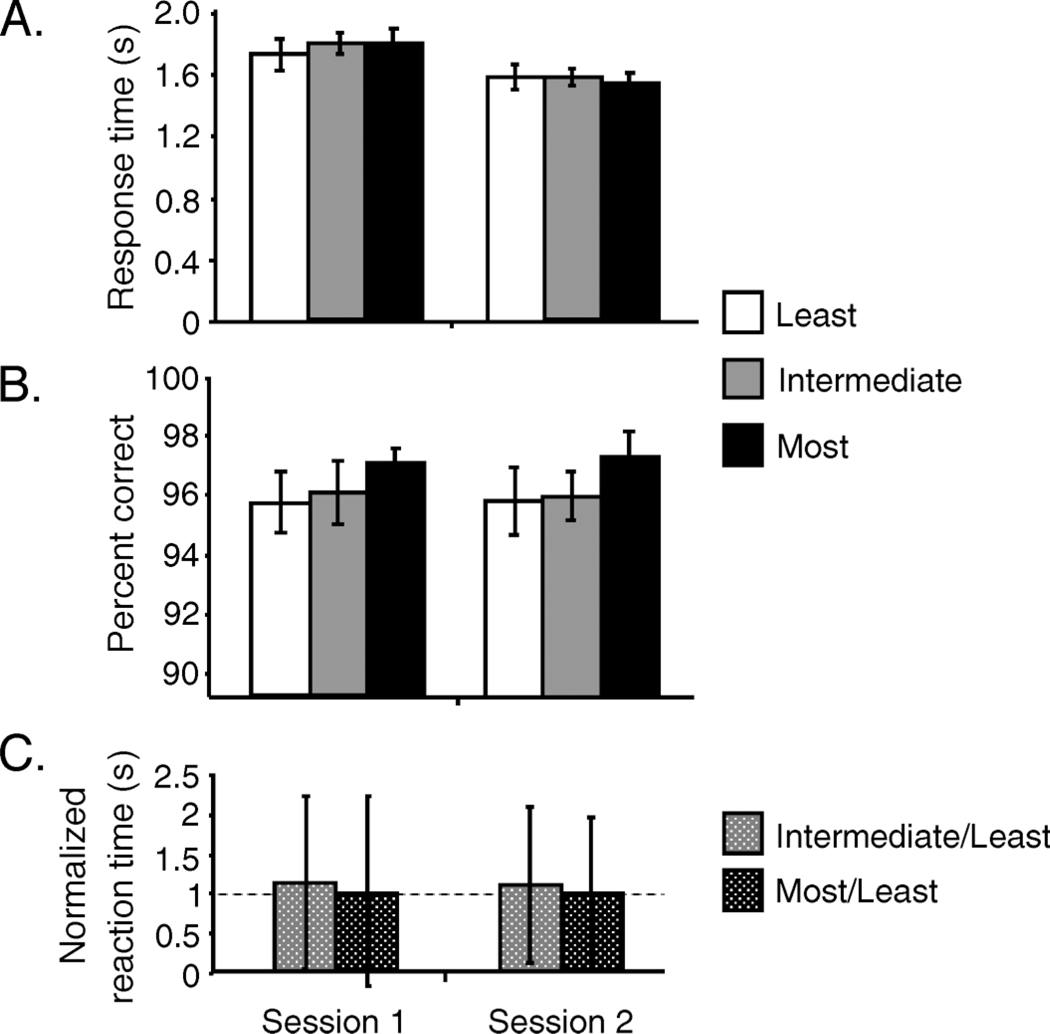
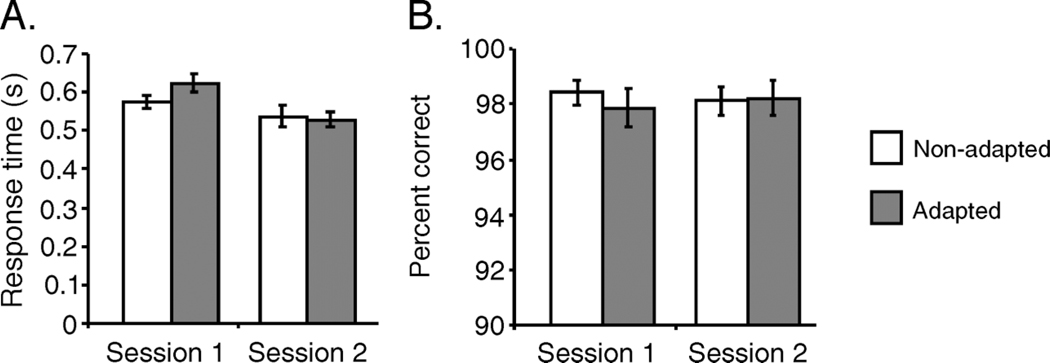
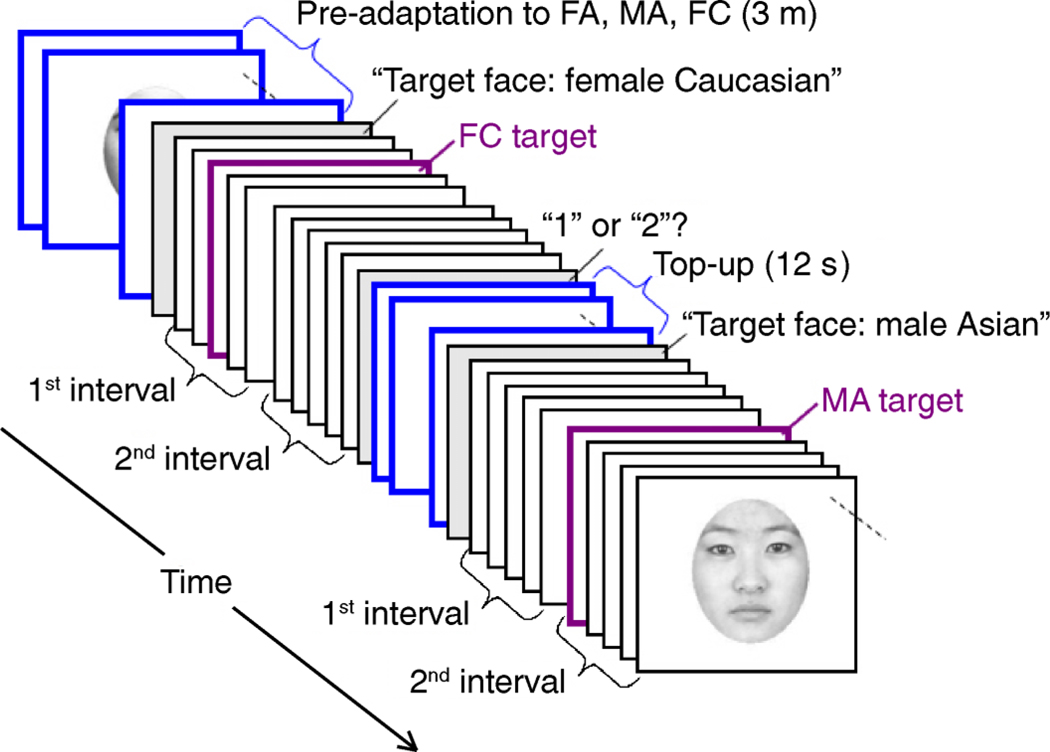
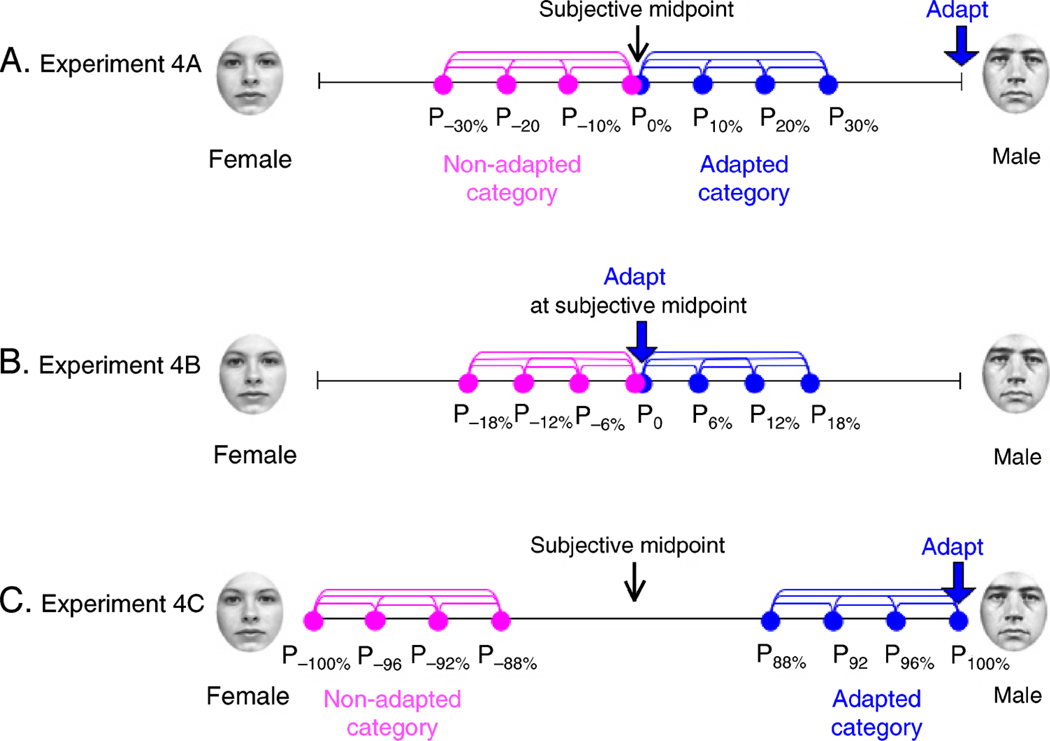
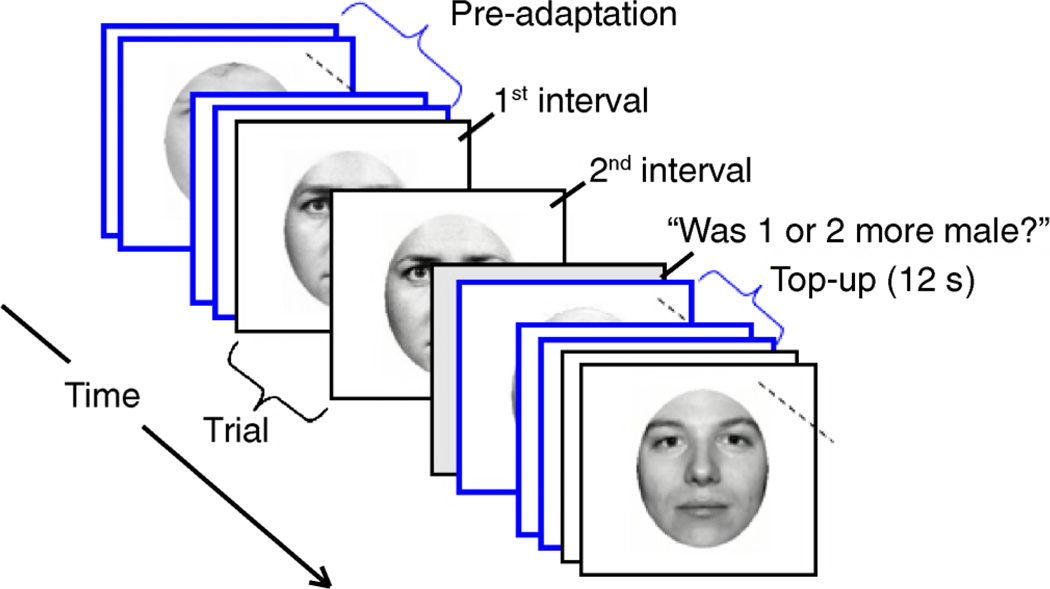
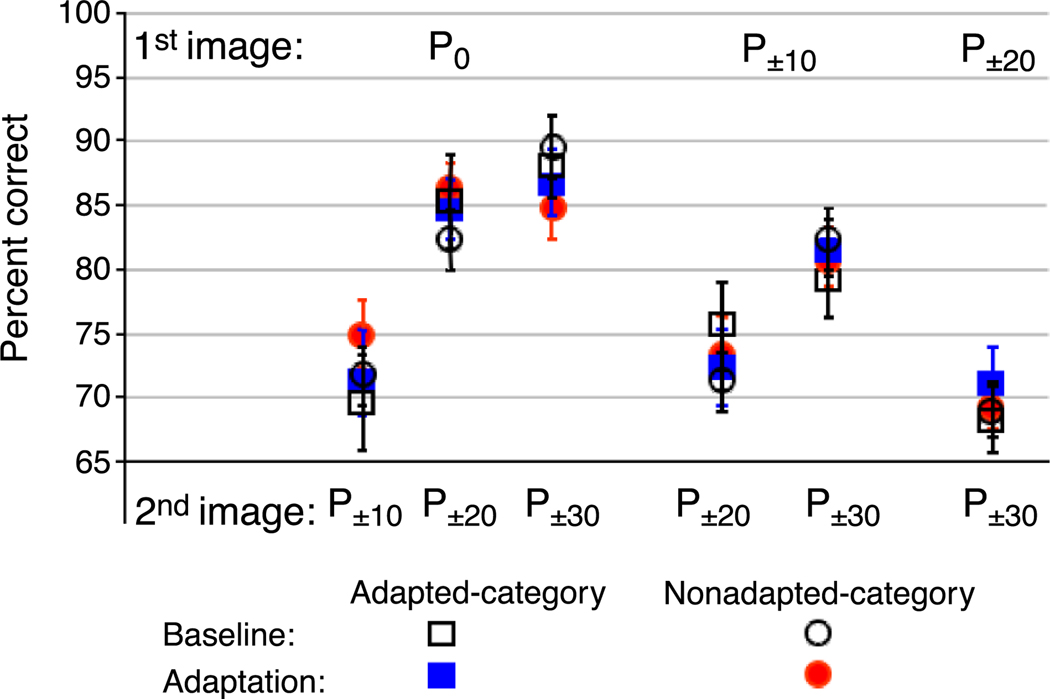
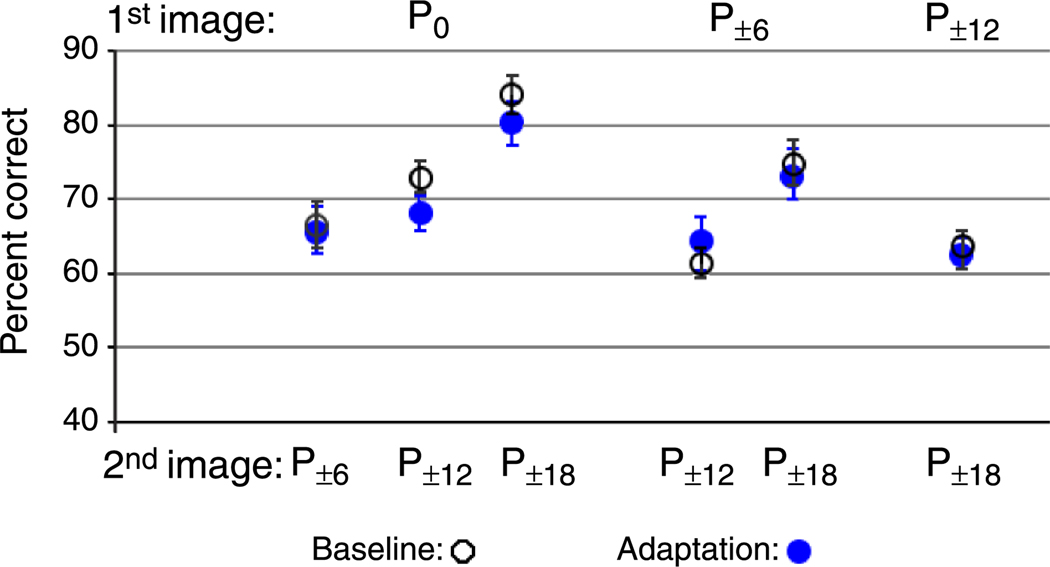
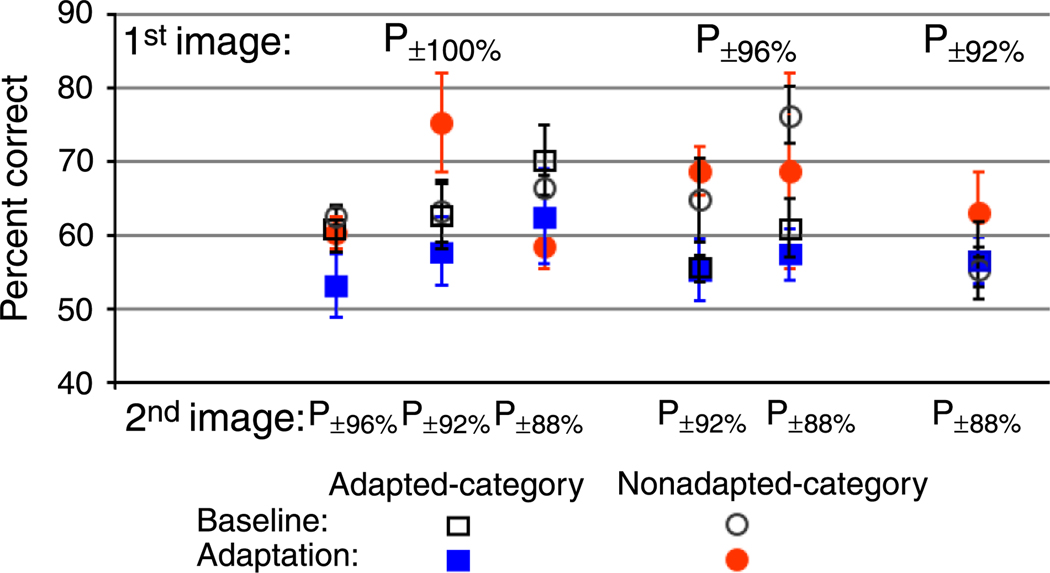
The face adaptation effect, as described by M. A. Webster and O. H. MacLin (1999), is a robust perceptual shift in the appearance of faces after a brief adaptation period. For example, prolonged exposure to Asian faces causes a Eurasian face to appear distinctly Caucasian. This adaptation effect has been documented for general configural effects, as well as for the facial properties of gender, ethnicity, expression, and identity. We began by replicating the finding that adaptation to ethnicity, gender, and a combination of both features induces selective shifts in category appearance. We then investigated whether this adaptation has perceptual consequences beyond a shift in the perceived category boundary by measuring the effects of adaptation on RSVP, spatial search, and discrimination tasks. Adaptation had no discernable effect on performance for any of these tasks.


Figures

Figure 1
Figure 1
Experiment 1 procedure and predictions. The four face categories are represented in each panel: MA, MC, FA, and FC faces in the top left, top right, bottom left, and bottom right, respectively. For all conditions, a single example is described in which subjects were first adapted to MA faces (blue circle). Jointly tuned (dashed circles) and singly tuned (dashed ovals) mechanisms that would be expected to be adapted during the task are shown. (A) Local adaptation for singly tuned mechanisms. Subjects discriminated the ethnicity of A/C male morphs. Mechanisms selective for Asian faces would be adapted (black dashed oval) while mechanisms selective for Caucasian faces would remain unadapted. We predict adaptation effects (blue arrow) whereby male faces appear more Caucasian. (B) Local adaptation for jointly tuned mechanisms. Mechanisms selective for MA faces would be adapted while mechanisms selective for MC faces would be unadapted; thus, we again predict an adaptation effect. (C) Remote adaptation for singly tuned mechanisms. Subjects discriminated the ethnicity of A/C female morphs. The adapted singly tuned mechanism is unselective for gender; however, adaptation would transfer to ethnicity discriminations of female faces. (D) Remote adaptation for jointly tuned mechanisms. Both mechanisms selective for FA and FC mediating the ethnicity discrimination are unadapted; thus, we predict no net effect (black line). (E) Contingent adaptation for singly tuned mechanisms. Subjects were adapted to MA and FC faces. Subjects then made ethnicity discriminations on A/C male morphs and A/C female morphs. Singly tuned mechanisms selective for both Asian and Caucasian faces would be adapted, resulting in no net effect. (F) Contingent adaptation for jointly tuned mechanisms. Mechanisms selective for FA and MC faces would remain unadapted, resulting in an adaptation effect.
Figure 2
Figure 2
Experiment 1 design and an example psychometric function for an example of the local adaptation condition (as described in Figure 1A). (A) Subjects performed a 2AFC classification of morphed face images. There was an initial 3-min adaptation period and a 12-s top-up period between each trial. (B) The x-axis represents the morph continuum; the y-axis represents the percentage of time that the subject (Subject 1) judged that face as appearing Asian. We measured the shift in the psychometric function along the y-axis by interpolating (blue dotted line) the post-adaptation psychometric function to find the morph (No. 31) that was seen as Asian on 50% of the trials and then interpolated again (vertical arrow) to find that the percentage of trials this morph was seen as Asian before adaptation was 79% (gray dotted line); this yields a 29% adaptation effect.
Figure 3
Figure 3
Experiment 1 predictions and results. Categorical boundary shifts were found in all subjects in all adaptation conditions. Error bars for individual subjects are calculated across all repeats within a condition. The error bar for the mean response is calculated across subjects.
Figure 4
Figure 4
An example of how qualities such as gender or ethnicity can result in a face being distinctive in a crowd. Copyright permission granted by “skeptical brotha” (skepticalbrotha@yahoo.com).
Figure 5
Figure 5
Experiment 2 design. Subjects were pre-adapted to faces from 3 categories and adaptation was topped-up between each block of 4 trials. The target face category was cued before each block. A face from each of the 4 categories appeared on each trial.
Figure 6
Figure 6
Experiment 2A results. (A) Average response times for search of the least (white), intermediate (gray), and most (black) adapted target face categories across subjects. A significant decrease in response times from Sessions 1 to 2 can be attributed to practice effects (p < .0014). (B) There was no significant difference in percent correct across adaptation levels and sessions. (C) Normalized reaction times show no significant difference from 1 (dotted line), indicating no effect of the extent of adaptation on reaction time.
Figure 7
Figure 7
Experiment 2B results. (A) Average response times across all subjects for search of the nonadapted (white) and adapted (gray) face categories by session. (B) Average percent correct across subjects.
Figure 8
Figure 8
Experiment 3A design. Subjects were pre-adapted to faces from 3 categories and topped-up between each trial. The target category was cued before the onset of a trial. One of the two intervals contained the target face. An auditory tone indicated the onset of each of the two RSVP intervals. In Session 1 (baseline), there was no pre-adaptation, and phase-scrambled face images (from the appropriate face category that would be used as adaptors during the second session) replaced adapting face images during the shortened 4 s pseudo top-up period.
Figure 9
Figure 9
Experiment 4 design. (A) In Experiment 4A, subjects adapted to (for example) male faces then discriminated faces ranging from the midpoint to slightly female (nonadapted category condition) or from the midpoint to slight male (adapted category condition. (B) In Experiment 4B, subjects adapted to gender-neutral faces then discriminated faces on either side of the midpoint. (C) In Experiment 4C, subjects adapted to (for example) male faces then discriminated faces ranging from female to slightly less female (nonadapted category) or from male to slightly less male (adapted category).
Figure 10
Figure 10
Experiment 4 design. (A) Gender morph continuum. Subjects adapted to male faces, for example, discriminate faces on either side of their subjective midpoint: the nonadapted or adapted category. Subjects were pre-adapted and topped-up between each trial (baseline testing excluded the pre-adaptation period and substituted the top-up period with shorter duration of phase-scrambled face images). Each test face image is followed with a mask.
Figure 11
Figure 11
Experiment 4A results. Performance before and after adaptation for each discrimination comparison across all subjects. Percent correct is shown for adapted category (squares) and nonadapted category (circles) discriminations, before (open black symbols) and after (filled colored symbols) adaptation.
Figure 12
Figure 12
Experiment 4B results. Discrimination performance around the gender boundary before (open black circles) and after (filled blue circles) adaptation to gender-neutral faces.
Figure 13
Figure 13
Experiment 4C results. Discrimination performance around the endpoints of the male–female morph continuum before (open black symbols) and after (filled colored symbols) adaptation to fully male or fully female faces.
Figure 14
Figure 14
Possible response functions before (solid lines) and after (blue dotted lines) adaptation to male faces. (A) Responses saturate for fully male and female faces and adaptation results in a horizontal shift analogous to contrast gain control. (B) Responses are not yet saturated for fully male and female faces and adaptation results in a horizontal shift. (C) Responses saturate for fully male and female faces and adaptation results in a divisive shift. (D) Responses are not yet saturated for fully male and female faces and adaptation results in a divisive shift.

References

    1. Abbonizio G, Langley K, Clifford CW. Contrast adaptation may enhance contrast discrimination. Spatial Vision. 2002;16:45–58. - PubMed
    1. Barlow HB. Pattern recognition and the responses of sensory neurons. Annals of the New York Academy of Sciences. 1969;156:872–881. - PubMed
    1. Barlow HB. A theory about the functional role and synaptic mechanism of after-effects. In: Blakemore C, editor. Vision: Coding and efficiency. Cambridge: Cambridge University Press; 1991. pp. 363–375.
    1. Barlow HB, Földiák P. Adaptation and decorrelation in the cortex. In: Durbin R, Miall C, Mitchiso G, editors. The computing neuron. Boston: Addison-Wesley; 1989. pp. 54–72.
    1. Blakemore C, Campbell FW. Adaptation to spatial stimuli. The Journal of Physiology. 1969;200 - PubMed

Publication types