. 2008 Mar 4:8:77.
doi: 10.1186/1471-2148-8-77.

Birth-death prior on phylogeny and speed dating

Affiliations

Birth-death prior on phylogeny and speed dating

Orjan Akerborg et al. BMC Evol Biol. .

Abstract

Background: In recent years there has been a trend of leaving the strict molecular clock in order to infer dating of speciations and other evolutionary events. Explicit modeling of substitution rates and divergence times makes formulation of informative prior distributions for branch lengths possible. Models with birth-death priors on tree branching and auto-correlated or iid substitution rates among lineages have been proposed, enabling simultaneous inference of substitution rates and divergence times. This problem has, however, mainly been analysed in the Markov chain Monte Carlo (MCMC) framework, an approach requiring computation times of hours or days when applied to large phylogenies.

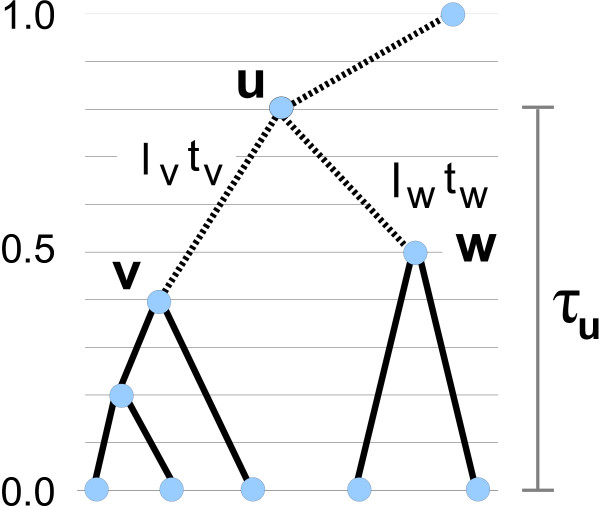
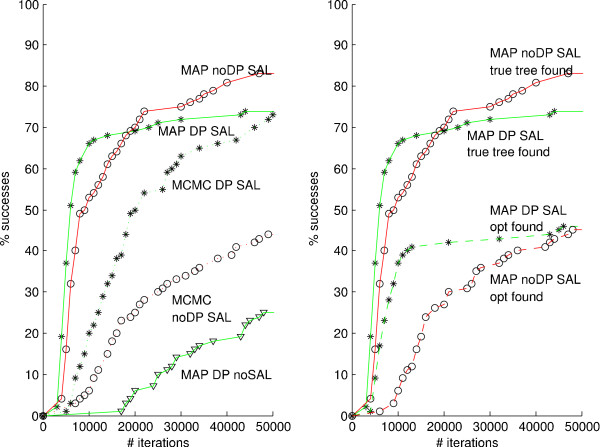
Results: We demonstrate that a hill-climbing maximum a posteriori (MAP) adaptation of the MCMC scheme results in considerable gain in computational efficiency. We demonstrate also that a novel dynamic programming (DP) algorithm for branch length factorization, useful both in the hill-climbing and in the MCMC setting, further reduces computation time. For the problem of inferring rates and times parameters on a fixed tree, we perform simulations, comparisons between hill-climbing and MCMC on a plant rbcL gene dataset, and dating analysis on an animal mtDNA dataset, showing that our methodology enables efficient, highly accurate analysis of very large trees. Datasets requiring a computation time of several days with MCMC can with our MAP algorithm be accurately analysed in less than a minute. From the results of our example analyses, we conclude that our methodology generally avoids getting trapped early in local optima. For the cases where this nevertheless can be a problem, for instance when we in addition to the parameters also infer the tree topology, we show that the problem can be evaded by using a simulated-annealing like (SAL) method in which we favour tree swaps early in the inference while biasing our focus towards rate and time parameter changes later on.

Conclusion: Our contribution leaves the field open for fast and accurate dating analysis of nucleotide sequence data. Modeling branch substitutions rates and divergence times separately allows us to include birth-death priors on the times without the assumption of a molecular clock. The methodology is easily adapted to take data from fossil records into account and it can be used together with a broad range of rate and substitution models.


Figures

Figure 1
Figure 1
A dynamic programming algorithm for branch length factorization. Values fu(τu) are calculated for all possible choices of τu. τu is u's divergence time counted from the leaves and it takes values corresponding to the equidistant grid. fu(τu) is a product of rate priors for the edges leading to u, u's contribution to the time prior, and the corresponding probabilities for u's children v and w: fv(τu) and fw(τu) respectively.
Figure 2
Figure 2
Three MAP inference methods – a comparison. The plot illustrates the fact that optimization over the full r × t parameter space (red curves) is much slower than both the equivalent optimization over l with subsequent DP-partition of l into r and t (blue curves), and the method combining r × t search with occasional DP-optimization interruptions (green curves). The solid curves show log-likelihoods including the priors p [r]p [t|T], whereas the dashed curves show the same results, but excluding that factor. Approximate point of convergence, i.e., the first point when 1000 subsequent steps has not resulted in any improvement, is marked with an asterisk.
Figure 3
Figure 3
Degree of parameter recovery. Rates and times inferred using the combined method (green curves), and the r × t-method (red curves) are compared with the corresponding true parameters that were used to generate the sequence data. Results for 10-leaf (upper figure), and 100-leaf trees (lower figure) are shown. We plot the deviation of the inferred parameter from the true value against different rate variances v. Rates and times are shown as stars and circles, respectively.
Figure 4
Figure 4
An rbcL hill-climbing vs. MCMC comparison. The speciation times inferred by using MCMC are shown by the tree nodes (means) and the blue bars (25% and 75% quantiles), respectively. The positions of the tree nodes, and the 25% and 75% bars, are relative to the position of the root, which has time value 1.0. Substitution rates are explicitly written out scaled by 100 on branches and are shown by yellow bars (mean, 25% and 75% quantiles). In both cases, corresponding MAP estimates are indicated by red stars.
Figure 5
Figure 5
Phylogeny inference simulations. Phylogeny inference simulations performed on 30-leaf trees are shown. An inference is considered successful at the first visit to the true tree, i.e., the tree generating the sequence data, or to a state with log-likelihood value at least as good as the true tree. In the left figure, we plot percent successes as a function of number of iterations for 100 runs on one tree with, respectively, MAP using the combined method, i.e., with DP (solid green line with stars indicating that at least one run has reached the success zone during the last 1000 steps), MAP using the r × t-method, i.e., without DP (solid red line with circles) and MCMC with (dotted green line with stars) and without DP (dotted red line with circles). We also plot results obtained with MAP and the combined method but without the SAL-method (solid green line with triangles). In the right figure, the comparison is between the same MAP runs with (again solid green line with stars) and without DP (again red solid line with circles) when a success is recorded as before, and the same methods (dashed green and red lines with stars and circles respectively) where a success is recorded when optimum for the true tree is reached.
Figure 6
Figure 6
Malagasy lemur phylogenetic tree. Phylogenetic tree used for divergence time inference in [23]. The upper part of the tree (categories a and b) contains the Malagasy lemurs, which are the main objects of analysis in the article, while the lower part (sections c and d), is for calibration purposes. We report our inference on branching times shown with blue circles C1–C8, these are calibration points in [23], and on branching times shown with white circles N1–N9, these are inferred also in [23].

References

    1. Felsenstein J. Evolutionary trees from DNA sequences: a maximum likelihood approach. J Mol Evol. 1981;17:368–376. doi: 10.1007/BF01734359. - DOI - PubMed
    1. Guindon S, Gascuel O. A simple, fast, and accurate algorithm to estimate large phylogenies by maximum likelihood. Syst Biol. 2003;52(5):696–704. doi: 10.1080/10635150390235520. - DOI - PubMed
    1. Stamatakis A, Ludwig T, Meier H. Proceedings of the 2004 ACM Symposium on Applied Computing. ACM Press, New York; 2004. A fast program for Maximum Likelihood-based inference of large phylogenetic trees.
    1. Yang Z, Rannala B. Bayesian phylogenetic inference using DNA sequences: A Markov chain Monte Carlo method. Mol Biol Evol. 1997;14(7):717–724. - PubMed
    1. Mau B, Newton M, Larget B. Bayesian phylogenetic inference via Markov chain Monte Carlo methods. Biometrics. 1999;55:1–12. doi: 10.1111/j.0006-341X.1999.00001.x. - DOI - PubMed

LinkOut - more resources