. 2008 Mar 5:9:140.
doi: 10.1186/1471-2105-9-140.

Normalization of oligonucleotide arrays based on the least-variant set of genes

Affiliations

Normalization of oligonucleotide arrays based on the least-variant set of genes

Stefano Calza et al. BMC Bioinformatics. .

Abstract

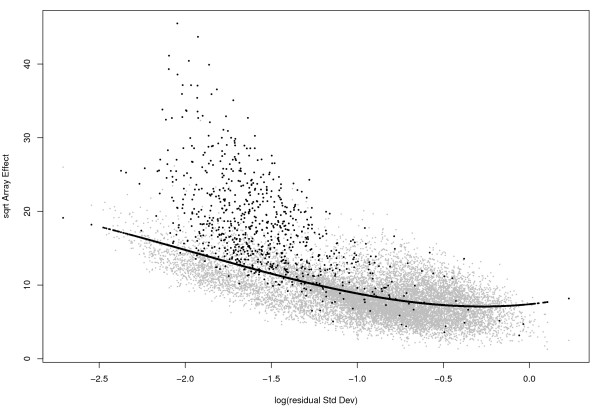
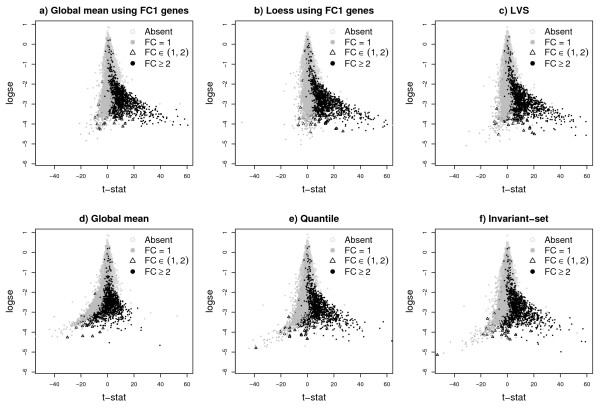
Background: It is well known that the normalization step of microarray data makes a difference in the downstream analysis. All normalization methods rely on certain assumptions, so differences in results can be traced to different sensitivities to violation of the assumptions. Illustrating the lack of robustness, in a striking spike-in experiment all existing normalization methods fail because of an imbalance between up- and down-regulated genes. This means it is still important to develop a normalization method that is robust against violation of the standard assumptions

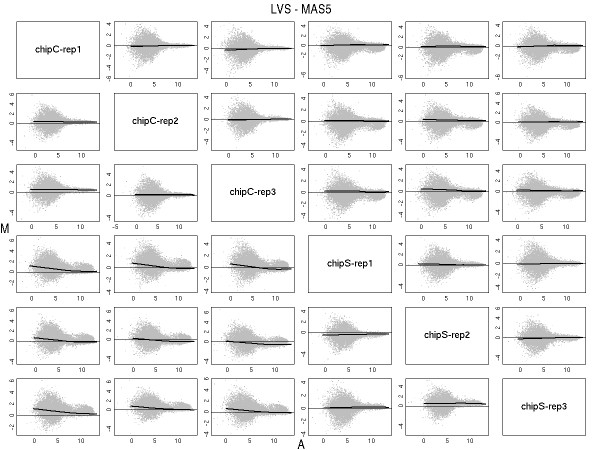
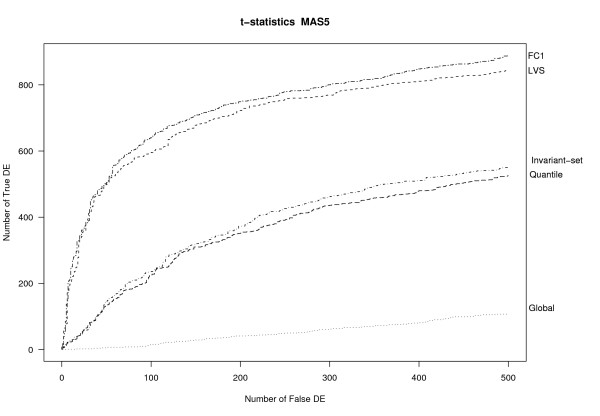
Results: We develop a new algorithm based on identification of the least-variant set (LVS) of genes across the arrays. The array-to-array variation is evaluated in the robust linear model fit of pre-normalized probe-level data. The genes are then used as a reference set for a non-linear normalization. The method is applicable to any existing expression summaries, such as MAS5 or RMA.

Conclusion: We show that LVS normalization outperforms other normalization methods when the standard assumptions are not satisfied. In the complex spike-in study, LVS performs similarly to the ideal (in practice unknown) housekeeping-gene normalization. An R package called lvs is available in http://www.meb.ki.se/~yudpaw.


Figures

Figure 1
Figure 1
RA-plot for Golden-Spike data. This plot shows the array-to-array variablility vs residual variance from the probe level linear model. The black line is the quantile regression curve at proportion τ = 0.6. The black points correspond to genes with FC≥ 2.
Figure 2
Figure 2
Plot of the t-statistic versus the log standard-error. Plot of the t-statistic versus the log standard-error for MAS5 expression values of the Golden-Spike data normalized using different methods. All normalization were performed after summarization of probe intensities. The FC1-based normalizations are ideal, and in real non-spike-in studies are not possible. LVS-normalization is closet to the FC1-based normalization. The others show negative bias for FC1 genes and suppressed values for genes with FC≥ 2.
Figure 3
Figure 3
MA plots. MA plots of each pair of samples of the Golden-Spike data using MAS5 values (below the diagonal) and after normalization with LVS (above the diagonal). Loess curves, computed from the LVS genes, were drawn in think lines. As expected the normalization has removed any trend.
Figure 4
Figure 4
OC curves. OC curves for different normalization applied to MAS5-expression values of the Golden-Spike data. FC = 1 refers to the loess normalization on FC1 genes.
Figure 5
Figure 5
RA-plots for spike-in data. RA-plots for both HGU133A and HGU95A spike in data. These plots show the array-to-array variability vs residual variance from the probe-level linear model. The black line represents the fitted values from a quantile regression with τ = 0.6. The triangles represent the spiked-in genes. The stars are the new spike-ins according to MCGee et al. (2006).
Figure 6
Figure 6
OC curves for HGU133A spike-in data. OC curves for different normalizations applied to either MAS5 or RMA expression measures for the HGU133A spike-in experiment. The standard t-statistic was used as the criterion to setup the curve.

References

    1. Hartemink A, Gifford D, Jaakkola T, Young R. Maximum likelihood estimation of optimal scaling factors for expression array normalizations. IN SPIE Bios. 2001.
    1. Hoffmann R, Seidl T, Dugas M. Profound effect of normalization on detection of differentially expressed genes in oligonucleotide microarray data analysis. Genome Biol. 2002;3:research0033.1–0033.11. doi: 10.1186/gb-2002-3-7-research0033. - DOI - PMC - PubMed
    1. Workman C, Jensen LJ, Jarmer H, Berka R, Gautier L, Nielser HB, Saxild HH, Nielsen C, Brunak S, Knudsen S. A new non-linear normalization method for reducing variability in DNA microarray experiments. Genome Biol. 2002;3:research0048. doi: 10.1186/gb-2002-3-9-research0048. - DOI - PMC - PubMed
    1. Bolstad BM, Irizarry RA, Astrand M, Speed TP. A comparison of normalization methods for high density oligonucleotide array data based on variance and bias. Bioinformatics. 2003;19:185–193. doi: 10.1093/bioinformatics/19.2.185. - DOI - PubMed
    1. Affymetrix Statistical Algorithms Description Document. 2002.