

Using the optimal receiver operating characteristic curve to design a predictive genetic test, exemplified with type 2 diabetes
- PMID: 18319073
- PMCID: PMC2664997
- DOI: 10.1016/j.ajhg.2007.12.025
Using the optimal receiver operating characteristic curve to design a predictive genetic test, exemplified with type 2 diabetes
Abstract
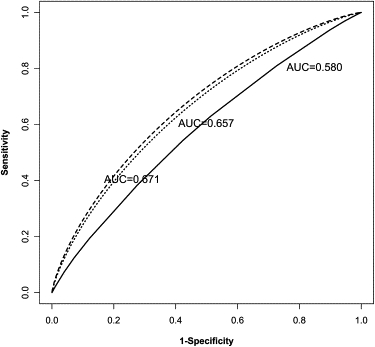
Current extensive genetic research into common complex diseases, especially with the completion of genome-wide association studies, is bringing to light many novel genetic risk loci. These new discoveries, along with previously known genetic risk variants, offer an important opportunity for researchers to improve health care. We describe a method of quick evaluation of these new findings for potential clinical practice by designing a new predictive genetic test, estimating its classification accuracy, and determining the sample size required for the verification of this accuracy. The proposed predictive test is asymptotically more powerful than tests built on any other existing method and can be extended to scenarios where loci are linked or interact. We illustrate the approach for the case of type 2 diabetes. We incorporate recently discovered risk factors into the proposed test and find a potentially better predictive genetic test. The area under the receiver operating characteristic (ROC) curve (AUC) of the proposed test is estimated to be higher (AUC = 0.671) than for the existing test (AUC = 0.580).
Figures
References
-
- Christensen K., Murray J.C. What genome-wide association studies can do for medicine. N. Engl. J. Med. 2007;356:1094–1097. - PubMed
-
- Yiannakouris N., Trichopoulou A., Benetou V., Psaltopoulou T., Ordovas J.M., Trichopoulos D. A direct assessment of genetic contribution to the incidence of coronary infarct in the general population Greek EPIC cohort. Eur. J. Epidemiol. 2006;21:859–867. - PubMed
-
- Lyssenko V., Almgren P., Anevski D., Perfekt R., Lahti K., Nissen M., Isomaa B., Forsen B., Homstrom N., Saloranta C. Predictors of and longitudinal changes in insulin sensitivity and secretion preceding onset of type 2 diabetes. Diabetes. 2005;54:166–174. - PubMed
Publication types
MeSH terms
Grants and funding
LinkOut - more resources
Full Text Sources
Other Literature Sources
Medical
