. 2008 Mar;82(3):696-711.
doi: 10.1016/j.ajhg.2008.01.008.

Epigenomic profiling reveals DNA-methylation changes associated with major psychosis

Affiliations

Epigenomic profiling reveals DNA-methylation changes associated with major psychosis

Jonathan Mill et al. Am J Hum Genet. 2008 Mar.

Abstract

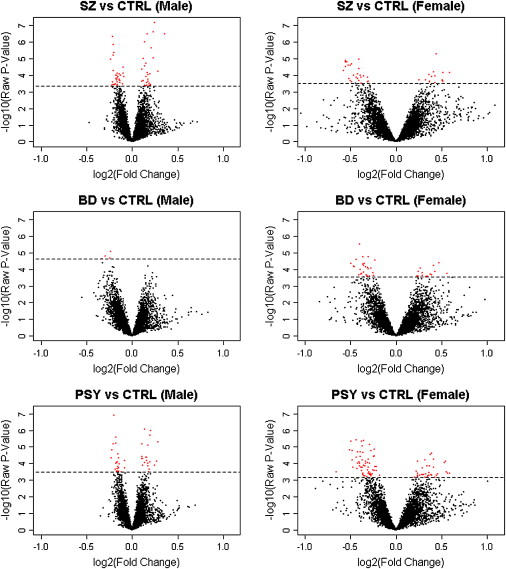
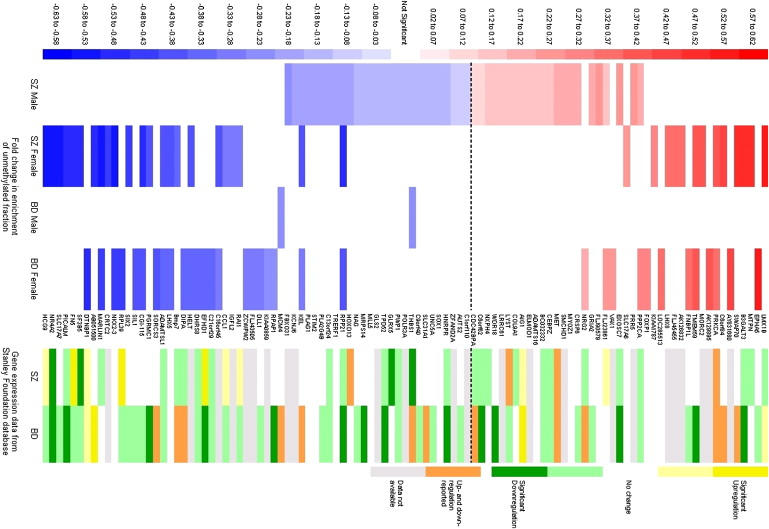
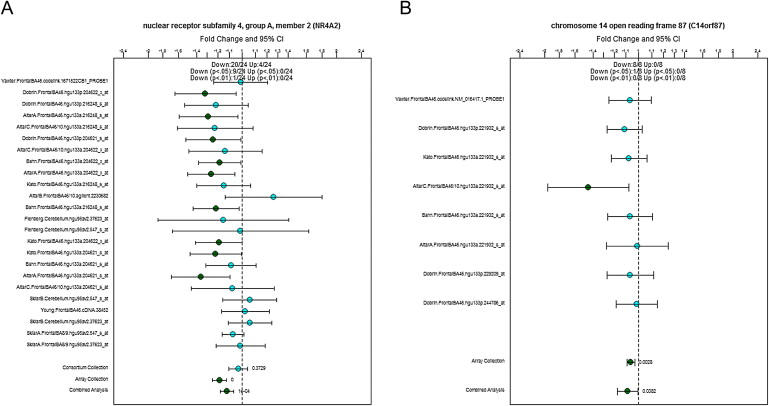
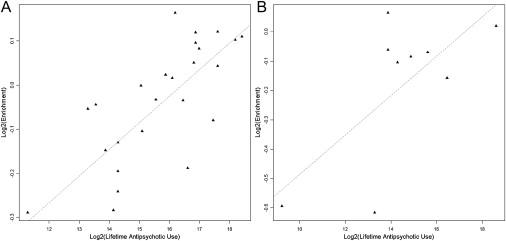
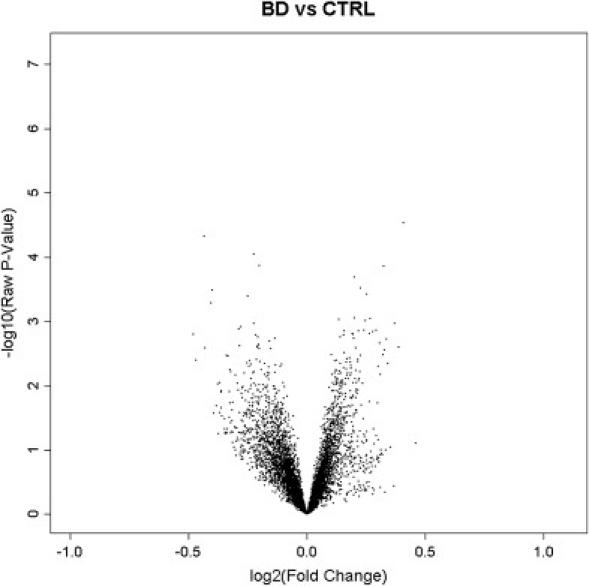
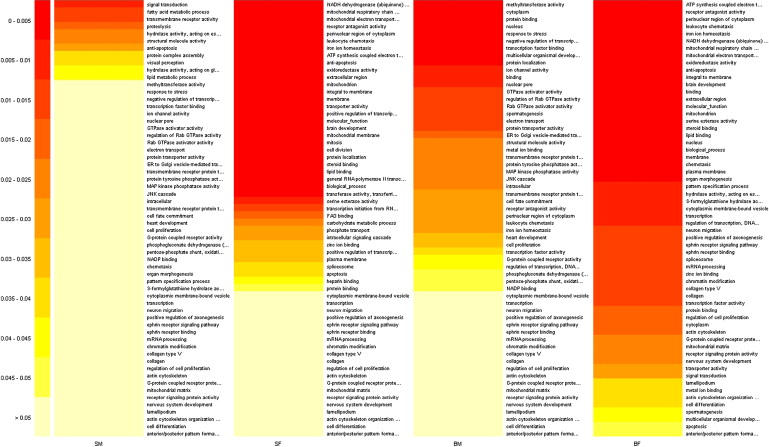
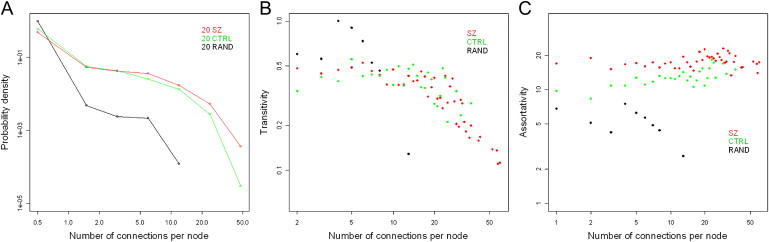
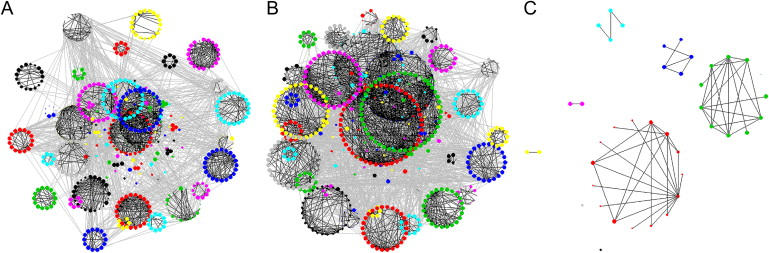
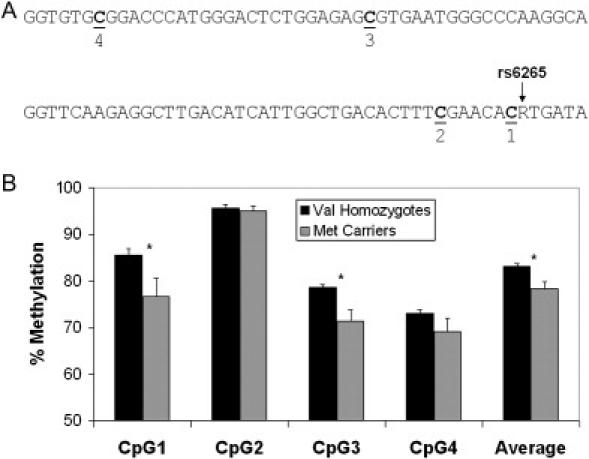
Epigenetic misregulation is consistent with various non-Mendelian features of schizophrenia and bipolar disorder. To date, however, few studies have investigated the role of DNA methylation in major psychosis, and none have taken a genome-wide epigenomic approach. In this study we used CpG-island microarrays to identify DNA-methylation changes in the frontal cortex and germline associated with schizophrenia and bipolar disorder. In the frontal cortex we find evidence for psychosis-associated DNA-methylation differences in numerous loci, including several involved in glutamatergic and GABAergic neurotransmission, brain development, and other processes functionally linked to disease etiology. DNA-methylation changes in a significant proportion of these loci correspond to reported changes of steady-state mRNA level associated with psychosis. Gene-ontology analysis highlighted epigenetic disruption to loci involved in mitochondrial function, brain development, and stress response. Methylome network analysis uncovered decreased epigenetic modularity in both the brain and the germline of affected individuals, suggesting that systemic epigenetic dysfunction may be associated with major psychosis. We also report evidence for a strong correlation between DNA methylation in the MEK1 gene promoter region and lifetime antipsychotic use in schizophrenia patients. Finally, we observe that frontal-cortex DNA methylation in the BDNF gene is correlated with genotype at a nearby nonsynonymous SNP that has been previously associated with major psychosis. Our data are consistent with the epigenetic theory of major psychosis and suggest that DNA-methylation changes are important to the etiology of schizophrenia and bipolar disorder.


Figures

Figure 1
Figure 1
Frontal-Cortex DNA-Methylation Differences Volcano plots showing raw p values for differential DNA methylation versus fold change observed when the hypomethylated fraction of brain DNA from psychosis patients was compared to that from unaffected individuals by use of 12K CpG-island microarrays. Each spot (red and black) represents an array probe averaged across all individuals in a group, with red spots denoting probes with FDR < 5%. SZ indicates schizophrenia, BD indicates bipolar disorder, and PSY indicates combined psychosis group (SZ and BD).
Figure 2
Figure 2
FDR-Significant DNA-Methylation Differences Associated with Major Psychosis A positive fold change (red) corresponds to lower DNA methylation in the affected group, and a negative fold change (blue) corresponds to higher DNA methylation in the affected group. Also shown are gene-expression data from the same group of samples obtained from the Stanley Research Foundation database. Dark yellow/green corresponds to significant transcript up-/downregulation in a meta-analysis of all expression studies performed on these samples, and light yellow/green corresponds to evidence of significant up-/downregulation from at least one study. Orange indicates that expression has been reported as altered in both directions in different studies. Grey denotes missing data.
Figure 3
Figure 3
Examples of Data Obtained from the Stanley Research Foundation Expression Database Shown is down-regulation of (A) NR4A2 and (B) GLRX5 (alternative name C14orf87) in SZ samples obtained from the Stanley Array Consortium. Data points refer to the relative expression fold change in the affected group relative to control samples. Scale bars denote 95% confidence intervals.
Figure 4
Figure 4
DNA Methylation and Lifetime Antipsychotic Use Correlation between DNA methylation in the promoter of the mitogen-activated protein kinase kinase I gene (MEK1) and lifetime antipsychotic use in (A) male schizophrenia samples (r2 = 0.6, p = 6.76E-06) and (B) female schizophrenia samples (r2 = 0.5, p = 0.04).
Figure 5
Figure 5
Germline DNA-Methylation Differences Volcano plot showing raw p values for differential DNA methylation versus fold change observed when the hypomethylated fraction of germline DNA from BD patients was compared to that from unaffected individuals by use of 12K CpG-island microarrays. No FDR-significant DNA-methylation differences were observed.
Figure 6
Figure 6
Bisulfite Modification and Pyrosequencing Verification of CpG-Methylation Differences in Two Genes Nominated from Microarray Analysis (A) Microarray signal intensity for probes located in CpG islands in the promoter region of WDR18 and RPL39. Scale bars denote 95% confidence intervals. For WDR18, male SZ samples had significantly higher intensities than did unaffected control samples (raw p = 4.5E-05, FDR corrected = 0.05), indicating hypomethylation in affected individuals. For RPL39, female BD samples had significantly lower intensities than unaffected control samples (raw p = 4.0E-05, FDR corrected = 0.02), indicating hypermethylation in affected individuals. (B) Bisulfite mapping across amplicons spanning regions interrogated by CpG-island microarrays confirms DNA-methylation changes predicted by microarrays: shown are WDR18 hypomethylation in male SZ samples (p < 0.001) and RPL39 hypermethylation in female BD samples (p = 0.009). (C) Predicted transcription-factor binding sites in the regions of WDR18 and RPL39 analyzed by pyrosequencing. Boxes indicate CpG sites with the largest DNA-methylation differences in affected individuals. (D) Example pyrograms demonstrating relative WDR18 hypomethylation in a SZ male sample and RPL39 hypermethylation in a BD female sample.
Figure 7
Figure 7
Gene-Ontology Analysis The top 60 GO categories for each diagnostic group (SM = SZ male, SF = SZ female, BM = BD male, BF = BD female). Colors denote raw p values. See Table S4 for additional data.
Figure 8
Figure 8
Network Analysis of DNA-Methylation Microarray Data (A) The average number of connections between nodes is higher in the SZ sample group (2.7) compared to the CTRL sample group (1.7). (B) The clustering coefficient is high in both groups (CTRL = 0.17, SZ = 0.22) and decreases with increasing connections, suggesting that both groups are hierarchical to the same degree. (C) Assortativity was found to be higher in SZ (knn = 9) compared to CTRL (knn = 6), reflecting the higher number of connections between nodes in the SZ data. A simulated dataset generated by random shuffling of microarray data produced a network with a low number of connections and a low clustering coefficient.
Figure 9
Figure 9
Reduced Epigenetic Modularity in Major Psychosis Partial-correlation network analysis of microarray data illustrating significant connections between nodes (p < 1e-7) demonstrating strong hierarchical modularity for (A) male CTRL samples (n = 20) and (B) male SZ samples (n = 20) but not for (C) a randomly shuffled dataset. Although modularity is apparent in both sample groups, it is lower in the SZ group (0.44) than in the CTRL group (0.56). A similar pattern of modularity is seen in the comparison of methylation between germline male BD samples (0.33) and unaffected CTRLs (0.47).
Figure 10
Figure 10
BDNF genotype and DNA Methylation Association of BDNF genotype with DNA methylation at nearby exonic CpG sites in DNA obtained from frontal-cortex brain tissue. (A) the exonic region of BDNF covered by our bisulfite mapping indicating the four CpG sites tested. (B) DNA methylation at the four CpG sites in the vicinity of rs6265. Asterisk denotes t test of p < 0.05, bars denote mean standard error.

References

    1. Craddock N., O'Donovan M.C., Owen M.J. Genes for schizophrenia and bipolar disorder? Implications for psychiatric nosology. Schizophr. Bull. 2006;32:9–16. - PMC - PubMed
    1. Craddock N., O'Donovan M.C., Owen M.J. The genetics of schizophrenia and bipolar disorder: dissecting psychosis. J. Med. Genet. 2005;42:193–204. - PMC - PubMed
    1. Petronis A. The origin of schizophrenia: genetic thesis, epigenetic antithesis, and resolving synthesis. Biol Psychiatry. 2004;55:965–970. - PubMed
    1. Craddock N., Jones I. Genetics of bipolar disorder. J. Med. Genet. 1999;36:585–594. - PMC - PubMed
    1. McGuffin P., Asherson P., Owen M., Farmer A. The strength of the genetic effect. Is there room for an environmental influence in the aetiology of schizophrenia? Br. J. Psychiatry. 1994;164:593–599. - PubMed

Publication types