. 2008 Sep 6;5(26):1001-7.
doi: 10.1098/rsif.2008.0013.

Dynamic social networks and the implications for the spread of infectious disease

Affiliations

Dynamic social networks and the implications for the spread of infectious disease

Jonathan M Read et al. J R Soc Interface. .

Abstract

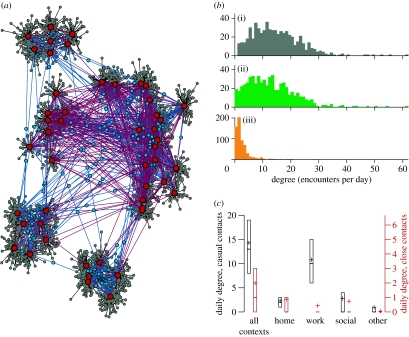
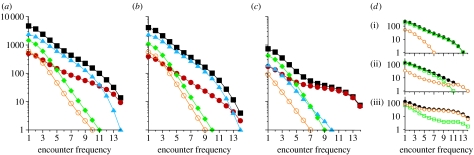
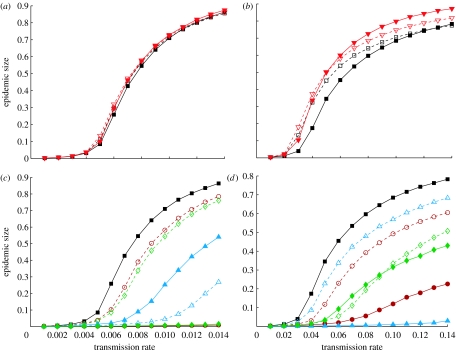
Understanding the nature of human contact patterns is crucial for predicting the impact of future pandemics and devising effective control measures. However, few studies provide a quantitative description of the aspects of social interactions that are most relevant to disease transmission. Here, we present the results from a detailed diary-based survey of casual (conversational) and close contact (physical) encounters made by a small peer group of 49 adults who recorded 8,661 encounters with 3,528 different individuals over 14 non-consecutive days. We find that the stability of interactions depends on the intimacy of contact and social context. Casual contact encounters mostly occur in the workplace and are predominantly irregular, while close contact encounters mostly occur at home or in social situations and tend to be more stable. Simulated epidemics of casual contact transmission involve a large number of non-repeated encounters, and the social network is well captured by a random mixing model. However, the stability of the social network should be taken into account for close contact infections. Our findings have implications for the modelling of human epidemics and planning pandemic control policies based on social distancing methods.


Figures

Figure 1
Figure 1
The network and properties of social contacts reported in the survey. (a) A network representation of all encounters reported in the survey. Red circles represent the participants, blue circles are non-participating individuals who are encountered by more than one participant and grey circles are non-participating individuals encountered only by one participant. Red lines represent encounters made between participants, blue lines are encounters with non-participating individuals who are encountered by more than one participant and grey lines are encounters with non-participating individuals encountered only by one participant. (b) The distribution of daily encounters (degree) recorded by participants for (i) all contact types (mean, 14.29; grey bars), (ii) contacts that were conversational only (mean, 12.3; green bars) and (iii) contacts that included skin-to-skin physical contact (mean, 1.99; orange bars). Each day reported by each participant is treated independently. (c) Daily degree by social context for casual contacts (all contacts, black) and close contacts (only physical contacts, red). ‘Work’ excludes reported weekend work contacts; ‘other’ combines travel and shopping encounters. Boxes bound the 25 and 75% quartiles; horizontal lines and pluses represent the median and mean, respectively. Note that casual and close contacts are plotted on different scales in different colours (black and red, respectively).
Figure 2
Figure 2
The effect of contact type and social context on the pattern of repeated encounters between the same individuals. The cumulative distribution of repeated contacts for (a) all contacts, (b) conversational contacts and (c) only contacts that included physical contact. For each frequency the number of contacts encountered with that frequency or greater is plotted. Distributions are split by social context: black squares, all contexts combined; red circles, contacts within the participant's home; blue triangles, contacts at the workplace or university; green diamonds, contacts made in a socializing context; and orange open circles, contacts made during travel or shopping. (d) The influence of participants' housing type on the cumulative distribution of repeat encounters with the same individual at home. Housing types are (i) halls (large student apartments of single or multiple occupancy rooms, median household size: h=7, n=11), (ii) shared (normal residential properties shared with others: h=2.5, n=17) and (iii) family (household with partner or children, h=2, n=19); see the electronic supplementary material for more details. Black circles represent all encounters, green squares denote conversational contacts and orange circles denote physical contacts.
Figure 3
Figure 3
Simulated SIR-type epidemics upon a range of generated networks. (a,b) show the final epidemic size for a variety of interaction assumptions for all contacts and just physical contacts, respectively. Filled squares, weighted network; open squares, unweighted network; filled down triangles, weighted mean field; open down triangles, unweighted mean field. (c,d) show the final size of epidemics for the weighted network model when different social settings are excluded. Filled squares, all; open circles, not home; open triangles, not work; open diamonds, not social; filled circles, just home; filled triangles, just work; filled diamonds, just social. The parameter values used are as follows: population size, 4700; recovery rate of infectious individuals g, 0.0714 per day equating to an average infectious period of 14 days. Transmission rate is given per infectious period. Points represent the mean from 100 realizations of the epidemic on a single network.

References

    1. Anderson R.M, May R.M. Oxford University Press; Oxford, UK: 1991. Infectious diseases of humans: dynamics and control.
    1. Bartlett M.S. Methuen; London, UK: 1960. Stochastic population models in ecology and epidemiology.
    1. Bernard H.R, Killworth P.D, McCarty C, Shelley G.A, Robinson S. Comparing four different methods for measuring personal social networks. Soc. Networks. 1990;12:179–215. doi: 10.1016/0378-8733(90)90005-T. - DOI
    1. Beutels P, Shked Y, Aetrs M, van Damme P. Social mixing patterns for transmission models of close contact infections: exploring self-evaluation and diary-based data collection through a web-based interface. Epidemiol. Infect. 2006;134:1158–1166. doi: 10.1017/S0950268806006418. - DOI - PMC - PubMed
    1. de Sola Pool I, Kochen M. Contacts and influence. Soc. Networks. 1978;1:5–51. doi: 10.1016/0378-8733(78)90011-4. - DOI

Publication types

LinkOut - more resources