When did HIV incidence peak in Harare, Zimbabwe? Back-calculation from mortality statistics
- PMID: 18320032
- PMCID: PMC2248619
- DOI: 10.1371/journal.pone.0001711
When did HIV incidence peak in Harare, Zimbabwe? Back-calculation from mortality statistics
Abstract
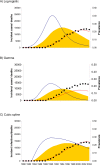
HIV prevalence has recently begun to decline in Zimbabwe, a result of both high levels of AIDS mortality and a reduction in incident infections. An important component in understanding the dynamics in HIV prevalence is knowledge of past trends in incidence, such as when incidence peaked and at what level. However, empirical measurements of incidence over an extended time period are not available from Zimbabwe or elsewhere in sub-Saharan Africa. Using mortality data, we use a back-calculation technique to reconstruct historic trends in incidence. From AIDS mortality data, extracted from death registration in Harare, together with an estimate of survival post-infection, HIV incidence trends were reconstructed that would give rise to the observed patterns of AIDS mortality. Models were fitted assuming three parametric forms of the incidence curve and under nine different assumptions regarding combinations of trends in non-AIDS mortality and patterns of survival post-infection with HIV. HIV prevalence was forward-projected from the fitted incidence and mortality curves. Models that constrained the incidence pattern to a cubic spline function were flexible and produced well-fitting, realistic patterns of incidence. In models assuming constant levels of non-AIDS mortality, annual incidence peaked between 4 and 5% between 1988 and 1990. Under other assumptions the peak level ranged from 3 to 8% per annum. However, scenarios assuming increasing levels of non-AIDS mortality resulted in implausibly low estimates of peak prevalence (11%), whereas models with decreasing underlying crude mortality could be consistent with the prevalence and mortality data. HIV incidence is most likely to have peaked in Harare between 1988 and 1990, which may have preceded the peak elsewhere in Zimbabwe. This finding, considered alongside the timing and location of HIV prevention activities, will give insight into the decline of HIV prevalence in Zimbabwe.
Conflict of interest statement
Figures


Similar articles
-
HIV decline in Zimbabwe due to reductions in risky sex? Evidence from a comprehensive epidemiological review.Int J Epidemiol. 2010 Oct;39(5):1311-23. doi: 10.1093/ije/dyq055. Epub 2010 Apr 20. Int J Epidemiol. 2010. PMID: 20406793 Free PMC article.
-
Estimating HIV incidence from age-specific prevalence data: comparison with concurrent cohort estimates in a study of male factory workers, Harare, Zimbabwe.AIDS. 1998 Oct 22;12(15):2049-58. doi: 10.1097/00002030-199815000-00017. AIDS. 1998. PMID: 9814874
-
Recent upturn in mortality in rural Zimbabwe: evidence for an early demographic impact of HIV-1 infection?AIDS. 1997 Aug;11(10):1269-80. doi: 10.1097/00002030-199710000-00011. AIDS. 1997. PMID: 9256946
-
Projecting the impact of AIDS on mortality.AIDS. 1998;12 Suppl 1:S29-39. AIDS. 1998. PMID: 9677187 Review.
-
The impact of AIDS on adult mortality: evidence from national and regional statistics.AIDS. 2004 Jun;18 Suppl 2:S19-26. doi: 10.1097/00002030-200406002-00003. AIDS. 2004. PMID: 15319740 Review.
Cited by
-
The incidence of HIV among women recruited during late pregnancy and followed up for six years after childbirth in Zimbabwe.BMC Public Health. 2010 Nov 3;10:668. doi: 10.1186/1471-2458-10-668. BMC Public Health. 2010. PMID: 21047407 Free PMC article.
-
Modelling HIV incidence and survival from age-specific seroprevalence after antiretroviral treatment scale-up in rural South Africa.AIDS. 2013 Sep 24;27(15):2471-9. doi: 10.1097/01.aids.0000432475.14992.da. AIDS. 2013. PMID: 23842131 Free PMC article.
-
HIV prevalence and associated behavioral factors in Lesotho, Kenya, Malawi, and Uganda.Croat Med J. 2010 Jun;51(3):271-3. doi: 10.3325/cmj.2010.51.271. Croat Med J. 2010. PMID: 20564772 Free PMC article. No abstract available.
-
Economy, migrant labour and sex work: interplay of HIV epidemic drivers in Zimbabwe over three decades.AIDS. 2019 Jan 27;33(1):123-131. doi: 10.1097/QAD.0000000000002066. AIDS. 2019. PMID: 30475261 Free PMC article.
-
Evolution and molecular epidemiology of subtype C HIV-1 in Zimbabwe.AIDS. 2009 Nov 27;23(18):2523-32. doi: 10.1097/QAD.0b013e3283320ef3. AIDS. 2009. PMID: 19770693 Free PMC article.
References
-
- UNAIDS. Evidence for HIV decline in Zimbabwe: a comprehensive review of the epidemiological data. 2005
-
- Gregson S, Nyamukapa CA, Garnett GP, Wambe M, Lewis JJ, et al. HIV infection and reproductive health in teenage women orphaned and made vulnerable by AIDS in Zimbabwe. AIDS Care. 2005;17:785–94. - PubMed
-
- Anderson RM, May RM, Boily MC, Garnett GP, Rowley JT. The spread of HIV-1 in Africa: sexual contact patterns and the predicted demographic impact of AIDS. Nature. 1991;352:581–9. - PubMed
-
- Wasserheit JN, Aral SO. The dynamic topology of sexually transmitted disease epidemics: implications for prevention strategies. J Infect Dis 174 Suppl. 1996;2:201–13. - PubMed
-
- Mbizvo MT, Latif AS, Machekano R, MacFarland W, Bassett MT, et al. HIV seroconversion among factory workers in Harare: who is getting newly infected? Cent Afr J Med. 1997;43:135–9. - PubMed
Publication types
MeSH terms
Grants and funding
LinkOut - more resources
Full Text Sources
Medical
Miscellaneous

