. 2008 Mar 11;105(10):3921-6.
doi: 10.1073/pnas.0800293105. Epub 2008 Mar 5.

Txnip balances metabolic and growth signaling via PTEN disulfide reduction

Affiliations

Txnip balances metabolic and growth signaling via PTEN disulfide reduction

Simon T Y Hui et al. Proc Natl Acad Sci U S A. .

Abstract

Thioredoxin-interacting protein (Txnip) inhibits thioredoxin NADPH-dependent reduction of protein disulfides. Total Txnip knockout (TKO) mice adapted inappropriately to prolonged fasting by shifting fuel dependence of skeletal muscle and heart from fat and ketone bodies to glucose. TKO mice exhibited increased Akt signaling, insulin sensitivity, and glycolysis in oxidative tissues (skeletal muscle and hearts) but not in lipogenic tissues (liver and adipose tissue). The selective activation of Akt in skeletal muscle and hearts was associated with impaired mitochondrial fuel oxidation and the accumulation of oxidized (inactive) PTEN, whose activity depends on reduction of two critical cysteine residues. Whereas muscle- and heart-specific Txnip knockout mice recapitulated the metabolic phenotype exhibited by TKO mice, liver-specific Txnip knockout mice were similar to WT mice. Embryonic fibroblasts derived from knockout mice also accumulated oxidized (inactive) PTEN and had elevated Akt phosphorylation. In addition, they had faster growth rates and increased dependence on anaerobic glycolysis due to impaired mitochondrial fuel oxidation, and they were resistant to doxorubicin-facilitated respiration-dependent apoptosis. In the absence of Txnip, oxidative inactivation of PTEN and subsequent activation of Akt attenuated mitochondrial respiration, resulting in the accumulation of NADH, a competitive inhibitor of thioredoxin NADPH-reductive activation of PTEN. These findings indicate that, in nonlipogenic tissues, Txnip is required to maintain sufficient thioredoxin NADPH activity to reductively reactivate oxidized PTEN and oppose Akt downstream signaling.


Conflict of interest statement

The authors declare no conflict of interest.

Figures

Fig. 1.
Fig. 1.
Plasma metabolic profile of fasting TKO, LKO, and MKO mice. (A–C) Plasma levels of triglycerides (A), 3-hydroxybutyrate (B), and glucose (C) in fasted WT, TKO, and LKO mice were determined (n = 9 per group). Results are presented as mean ± SD. **, P < 0.01 (versus WT). (D–F) Plasma levels of triglycerides (D), 3-hydroxybutyrate (E), and glucose (F) were determined from fasted MKO and homozygous Txnip floxed (fl/fl) control mice (n = 7 per group). Results are presented as mean ± SD. *, P < 0.05; **, P < 0.01 (versus fl/fl control mice).
Fig. 2.
Fig. 2.
Effects of Txnip ablation on glucose homeostasis and insulin sensitivity. (A) An i.p. glucose tolerance test (1 g/kg of body weight) was performed with fasted WT mice (filled diamonds), TKO mice (open squares), and MKO mice (filled triangles) (n = 4 per group). Results are presented as mean ± SD. **, P < 0.01 (for both TKO and MKO versus WT). (B–E) Hyperinsulinemic–euglycemic clamp studies using awake overnight-fasted mice (n = 8 per group). Data are means ± SD. **, P < 0.01 (versus WT). (B) Steady-state glucose infusion rate during 80–120 min of clamps. (C) Insulin-stimulated whole-body glucose turnover. (D) Basal hepatic glucose production rates. (E) Insulin-stimulated glucose uptake in gastrocnemius muscle.
Fig. 3.
Fig. 3.
Effects of Txnip ablation on Akt phosphorylation in chow and high-fat diet-fed TKO mice. (A) Insulin-stimulated Akt phosphorylation in soleus muscle and hearts of fasted mice (n = 4 per group) was measured. Samples were subject to Western blot analysis using antibodies against total Akt and phospho-Akt (Thr-308). * and **, P < 0.05 (from saline control WT and insulin-injected WT, respectively). (B and C) Basal level of Akt phosphorylation in the liver (B) and white adipose tissue (C) was compared between TKO mice and the WT littermates. The phospho-Akt/total Akt ratio was determined by densitometry and is presented as mean ± SD. (D) Effect of Txnip ablation on glucose homeostasis and insulin sensitivity in mice fed a high-fat diet for 12 weeks (n = 4 per group). Plasma glucose levels were determined after an overnight fast. Results are presented as mean ± SD. * and **, P < 0.01 (from chow-fed WT and high-fat diet-fed WT, respectively). (E) Insulin-stimulated Akt phosphorylation in soleus muscle and hearts from high-fat diet-fed mice (n = 3 per group). Each value represents the mean ± SD. *, P < 0.05 (versus WT saline control); **, P < 0.01 (versus WT insulin-injected control).
Fig. 4.
Fig. 4.
Effects of Txnip ablation on glucose homeostasis, mitochondrial fuel metabolism, and PTEN oxidation. (A) Fasted mice were injected i.v. with 0.5 μCi of [1-14C]-3-hydroxybutyrate (n = 5 per group). After 30 min, skeletal muscle was isolated from the hind limbs and 14C-radioactivity was determined. Results are presented as mean ± SD. (B) Soleus muscle from fasting mice was incubated with [114C]-3-hydroxybutyrate (0.5 μCi/ml) for 1 h at 30°C, and 14CO2 released was determined (n = 5 per group). Results are presented as mean ± SD. *, P < 0.01 (versus WT). (C) Soleus muscle from fasting mice was incubated with [U-14C]glucose (0.5 μCi/ml) for 1 h at 30°C, and 14CO2 released was determined (n = 5 per group). (D) Soleus muscle from fasting WT and TKO mice was incubated with sodium [114C]oleate (0.5 μCi/ml) for 1 h at 30°C, and 14CO2 released was determined (n = 5 per group). In C and D, results are presented as mean ± SD. *, P < 0.05 (versus WT). (E) Plasma lactate levels of fasting mice were measured (n = 6 per group). Results are presented as mean ± SD. **, P < 0.01 (versus WT). (F) Protein extracts of soleus muscle from WT and TKO mice (n = 4 per group) were prepared in the homogenization buffer containing 10 mM N-ethylmaleimide and 10 mM iodoacetate. Samples (20 μg of protein) were added to reducing buffers (sample buffer containing 2-mercaptoethanol) or nonreducing buffers (sample buffer without 2-mercaptoethanol). After SDS/PAGE, gels were electroblotted onto nylon membranes and subsequently probed with antibodies against PTEN and tubulin. Densitometry of immunoreactive bands (PTEN/tubulin) was quantitated by using a Bio-Rad image analyzer. Results are presented as mean ± SD. *, P < 0.05 (versus WT).
Fig. 5.
Fig. 5.
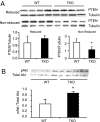
Accumulation of oxidized PTEN and phospho-Akt in MEFs. (A) Protein extracts of MEFs from WT and TKO mice (n = 4 per group) were prepared and analyzed as described in Fig. 4F. Results are presented as mean ± SD. *, P < 0.05 (versus WT). (B) Levels of Akt phosphorylation in unstimulated MEFs were compared between TKO mice and the WT littermates (n = 4 per group). The phospho-Akt(Ser-473)/total Akt ratio was determined by densitometry and is presented as mean ± SD. *, P < 0.05 (versus WT).
Fig. 6.
Fig. 6.
Expression of Warburg cancer cell phenotype by MEFs derived from TKO mice. (A) MEFs from WT (filled diamonds) and TKO (open squares) mice were seeded at the same density. The number of viable cells in each plate was counted at the time indicated. Each data point represents the mean ± SD of four replicates. (B) Uptake of [1-14C]deoxyglucose by WT and TKO MEFs was measured. Results are presented as mean ± SD from six samples per group. *, P < 0.05 (versus WT). (C) Cells were grown in quadruplicate in T-25 flasks to 80% confluence and then incubated with [U-14C]glucose at 37°C for 2 h. The amount of 14CO2 released was subsequently determined and normalized with cellular protein content. (D) Cells were seeded at 80% confluence in quadruplicate. Medium collected for 48 h was used to quantitate lactate. Results are presented as mean ± SD. *, P < 0.05 (versus control). (E) Cells were seeded at 70% confluence and incubated in growth media with or without 0.1 μM doxorubicin for 48 h. Percentage of survival was calculated by dividing viable cell counts from doxorubicin-exposed plates to control plate counts. Data are presented as mean ± SD. *, P < 0.05 (versus control).

Similar articles

Cited by

References

    1. Alessi DR, et al. Mechanism of activation of protein kinase B by insulin and IGF-1. EMBO J. 1996;15:6541–6551. - PMC - PubMed
    1. Maehama T, Dixon JE. The tumor suppressor, PTEN/MMAC1, dephosphorylates the lipid second messenger, phosphatidylinositol 3,4,5-trisphosphate. J Biol Chem. 1998;273:13375–13378. - PubMed
    1. Cantley LC. The phosphoinositide 3-kinase pathway. Science. 2002;296:1655–1657. - PubMed
    1. Kwon J, et al. Reversible oxidation and inactivation of the tumor suppressor PTEN in cells stimulated with peptide growth factors. Proc Natl Acad Sci USA. 2004;101:16419–16424. - PMC - PubMed
    1. Meuillet EJ, Mahadevan D, Berggren M, Coon A, Powis G. Thioredoxin-1 binds to the C2 domain of PTEN inhibiting PTEN′s lipid phosphatase activity and membrane binding: A mechanism for the functional loss of PTEN′s tumor suppressor activity. Arch Biochem Biophys. 2004;429:123–133. - PubMed

Publication types

MeSH terms