Review
. 2008 Mar;72(1):13-53, table of contents.
doi: 10.1128/MMBR.00026-07.

Cohesion group approach for evolutionary analysis of TyrA, a protein family with wide-ranging substrate specificities

Affiliations
Review

Cohesion group approach for evolutionary analysis of TyrA, a protein family with wide-ranging substrate specificities

Carol A Bonner et al. Microbiol Mol Biol Rev. 2008 Mar.

Abstract

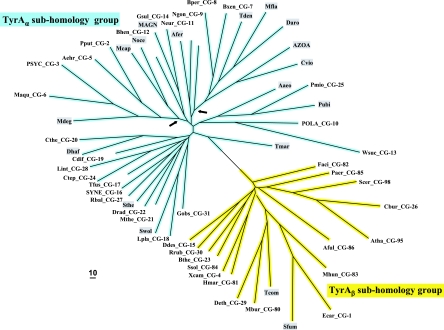
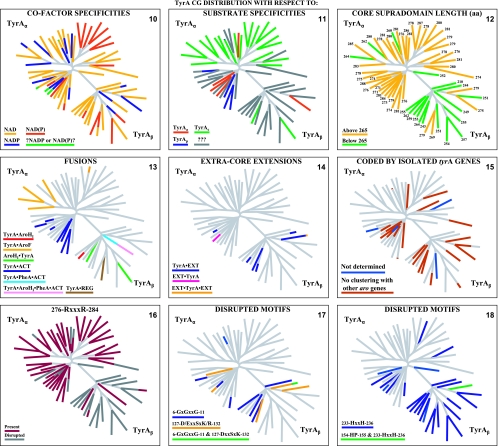
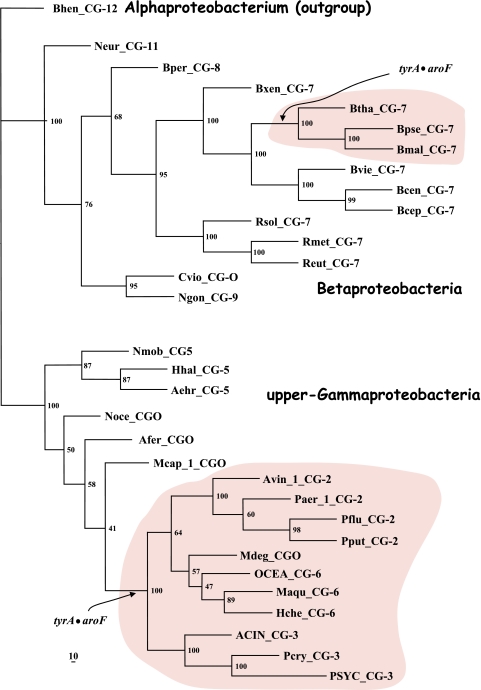
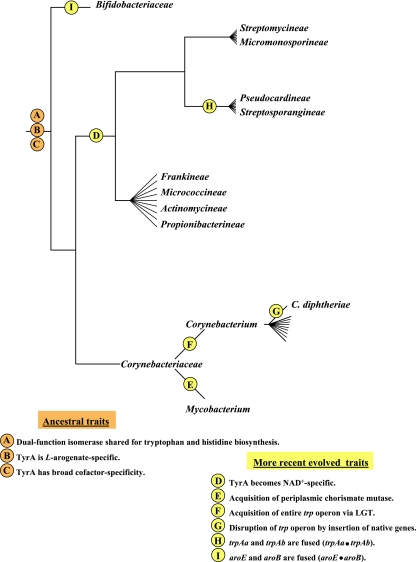
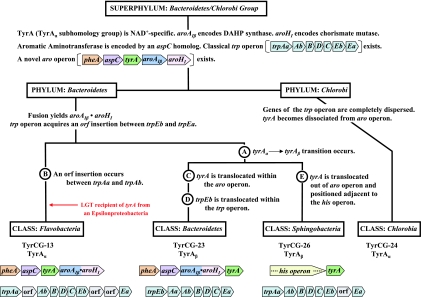
Many enzymes and other proteins are difficult subjects for bioinformatic analysis because they exhibit variant catalytic, structural, regulatory, and fusion mode features within a protein family whose sequences are not highly conserved. However, such features reflect dynamic and interesting scenarios of evolutionary importance. The value of experimental data obtained from individual organisms is instantly magnified to the extent that given features of the experimental organism can be projected upon related organisms. But how can one decide how far along the similarity scale it is reasonable to go before such inferences become doubtful? How can a credible picture of evolutionary events be deduced within the vertical trace of inheritance in combination with intervening events of lateral gene transfer (LGT)? We present a comprehensive analysis of a dehydrogenase protein family (TyrA) as a prototype example of how these goals can be accomplished through the use of cohesion group analysis. With this approach, the full collection of homologs is sorted into groups by a method that eliminates bias caused by an uneven representation of sequences from organisms whose phylogenetic spacing is not optimal. Each sufficiently populated cohesion group is phylogenetically coherent and defined by an overall congruence with a distinct section of the 16S rRNA gene tree. Exceptions that occasionally are found implicate a clearly defined LGT scenario whereby the recipient lineage is apparent and the donor lineage of the gene transferred is localized to those organisms that define the cohesion group. Systematic procedures to manage and organize otherwise overwhelming amounts of data are demonstrated.


Figures

FIG. 1.
FIG. 1.
Alternative flow routes between prephenate and l-tyrosine. The l-arogenate (AGN) flow route to l-tyrosine (TYR) is initiated when prephenate (PPA) is transaminated to produce l-arogenate. A specific and irreversible arogenate dehydrogenase (TyrAa) then converts l-arogenate to l-tyrosine. The 4-hydroxyphenylpyruvate (HPP) flow route to l-tyrosine is initiated when prephenate is utilized by a specific and irreversible prephenate dehydrogenase (TyrAp). An aromatic aminotransferase then transaminates 4-hydroxyphenylpyruvate to produce l-tyrosine. Broad-specificity dehydrogenases that are capable of using both prephenate and 4-hydroxyphenylpyruvate as reaction substrates are known as cyclohexadiencyl dehydrogenases (TyrAc). AA, amino acid; KA, keto acid.
FIG. 2.
FIG. 2.
Islands of cohesion groups displayed on a phylogenetic tree. Trimmed supradomain sequences, one representing each cohesion group or orphan and aligned as shown in Fig. 3, were used as input into a tree program as described in the Appendix. The resulting radial tree, visualized using TREEVIEW software (62), displays all of the unconnected cohesion groups. Two distinct subhomology groupings are evident: TyrAα (highlighted blue) and TyrAβ (highlighted yellow). See Table 2 for a succinct identification of each cohesion group. A complete, expanded version of Table 2 is available online (http://theseed.uchicago.edu/FIG/Html/TyrAExtended.html). Bootstrap values at all nodes are less than 58%, and therefore, the order of branching shown is not certain. The arrows indicate nodes that are common to TyrA sequences present in most upper Gammaproteobacteria (left arrowhead) or present in most Betaproteobacteria (right arrowhead). See the appendix for a URL for a website at which the organisms indicated by the four-letter codes are identified.
FIG. 3.
FIG. 3.
Master alignment of cohesion group representatives. The final manual alignment of 58 cohesion group representatives (see the appendix) was imported from the BioEdit alignment editor into the Word program to enhance presentation. TyrAα sequences are shown in the top section bounded at the top and bottom by sequences (Synechocystis sp. and Aquifex aeolicus) for which X-ray crystal structures are available. TyrAβ sequences are shown at the bottom. Amino acid residues shown to be important for NADP+ or for NAD+ in Synechocystis sp. and Aquifex aeolicus, respectively (48, 71), are shown in red with white lettering. Residues modeled in Synechocystis sp. and Aquifex aeolicus to be important for l-arogenate or for prephenate binding, respectively (48, 71), are shown in blue with white lettering. Relative residue position numbers are shown across the top. Invariant or near-invariant anchor residues are enclosed within vertical bars and highlighted yellow. Other highly conserved residues are shown in boldface type and highlighted yellow. Near-invariant residues that differ in a cohesion group representative, but which are nevertheless uniformly different throughout the cohesion group, are shown in boldface green type. The gray vertical band encloses residues in a variable loop (one to nine residues). Divergently pointed arrows at residue positions 216 and 217 mark the boundary between the pyridine nucleotide-binding domain and the catalytic domain. Regions that distinguish TyrAα and TyrAβ, as discussed in the text, are marked with numbers within triangles.
FIG. 3.
FIG. 3.
Master alignment of cohesion group representatives. The final manual alignment of 58 cohesion group representatives (see the appendix) was imported from the BioEdit alignment editor into the Word program to enhance presentation. TyrAα sequences are shown in the top section bounded at the top and bottom by sequences (Synechocystis sp. and Aquifex aeolicus) for which X-ray crystal structures are available. TyrAβ sequences are shown at the bottom. Amino acid residues shown to be important for NADP+ or for NAD+ in Synechocystis sp. and Aquifex aeolicus, respectively (48, 71), are shown in red with white lettering. Residues modeled in Synechocystis sp. and Aquifex aeolicus to be important for l-arogenate or for prephenate binding, respectively (48, 71), are shown in blue with white lettering. Relative residue position numbers are shown across the top. Invariant or near-invariant anchor residues are enclosed within vertical bars and highlighted yellow. Other highly conserved residues are shown in boldface type and highlighted yellow. Near-invariant residues that differ in a cohesion group representative, but which are nevertheless uniformly different throughout the cohesion group, are shown in boldface green type. The gray vertical band encloses residues in a variable loop (one to nine residues). Divergently pointed arrows at residue positions 216 and 217 mark the boundary between the pyridine nucleotide-binding domain and the catalytic domain. Regions that distinguish TyrAα and TyrAβ, as discussed in the text, are marked with numbers within triangles.
FIG. 4.
FIG. 4.
Selected examples of motifs in the discriminator region for cofactor binding. N-terminal TyrA sequence patterns that distinguish specificity for NAD+ (top), specificity for NADP+ (middle), and the ability to accept either cofactor [NAD(P)+] (bottom) are shown. Sequences shown begin with the last G (residue 11) of the GxGxxG motif in the Wierenga fingerprint (73). The variable gap of the Wierenga fingerprint is shown as a gray column. Examples of the smallest gap (one residue) and the largest gap (nine residues) are given. Two different patterns are shown for the NADP+ category, and two patterns are shown for the broad-specificity category. Motifs that center around the all-important residue 36 are shown for each of the five groups.
FIG. 5.
FIG. 5.
Divergence of cofactor specificity within cohesion group TyrCG-17. TyrA sequences from members of nine families of the order Actinomycetales and one (Bifidobacterium longum) from the family Bifidobacteriaceae within the order Bifidobacterales were aligned by entering the appropriate trimmed sequences into ClustalX, carrying out manual adjustments with the aid of the BioEdit alignment editor, and entering the final alignment into the Phylip program. The alignment (A) and the tree visualized with TREEVIEW (B) were imported into Word to enhance presentation. The Bifidobacterium longum sequence is shown in the middle of A for comparison with TyrA sequences from the single family (Corynebacterinceae) members in the bottom block and with members of the remaining families of the Actinomycetales (top block).
FIG. 5.
FIG. 5.
Divergence of cofactor specificity within cohesion group TyrCG-17. TyrA sequences from members of nine families of the order Actinomycetales and one (Bifidobacterium longum) from the family Bifidobacteriaceae within the order Bifidobacterales were aligned by entering the appropriate trimmed sequences into ClustalX, carrying out manual adjustments with the aid of the BioEdit alignment editor, and entering the final alignment into the Phylip program. The alignment (A) and the tree visualized with TREEVIEW (B) were imported into Word to enhance presentation. The Bifidobacterium longum sequence is shown in the middle of A for comparison with TyrA sequences from the single family (Corynebacterinceae) members in the bottom block and with members of the remaining families of the Actinomycetales (top block).
FIG. 6.
FIG. 6.
Snapshots of character state features. Eighteen panels are shown as mini-semblances of the bifurcated tree of cohesion groups portrayed in Fig. 2. Various character states of interest are displayed on these trees to facilitate comparisons. The organisms in all three domains of life that host the various TyrA cohesion groups are profiled in panels 1 to 8. The numbers at the branch ends in panels 2 to 8 indicate the total number of sequences within the cohesion group. An appropriate fraction of a given branch is color coded if the cohesion group has a “mixed” membership. Thus, in panel 3, the proximal half of the TyrCG-13 branch is color coded for the nine sequences of the Epsilonproteobacteria. In panel 6, the other (distal) half of the branch is color coded to indicate the nine TyrA sequences from the class Flavobacteria (Bacteroidetes). The locations of cohesion groups containing intruder sequences are identified in panel 9, e.g., the Flavobacteria mentioned above. TyrA character states associated with cofactor and cyclohexadienyl substrate specificities are displayed in accord with the color-coded legends (panels 10 and 11). In panel 10, “?NADP or NAD(P)?” means that whether the enzyme is NADP+ specific or whether it can use either cofactor is unknown, but we know that it cannot be NAD+ specific. The amino acid lengths of trimmed core supradomain TyrA sequences are given at the branch ends of panel 12. TyrA enzymes encoded by tyrA genes fused to other genes are depicted in panel 13. TyrA enzymes encoded by tyrA genes which are isolated from other aromatic pathway genes are shown in panel 15. The color-coded legends for panels 17 and 18 show conserved motifs (Fig. 3), which are disrupted or absent in the indicated cohesion groups (or a fraction thereof). These panels can be accessed at http://theseed.uchicago.edu/FIG/Html/TyrAPanels.html, where they can be expanded and sorted in order to facilitate comparisons. The interactive panels are linked to the extended table in order to quickly view the membership of any cohesion group of interest.
FIG. 6.
FIG. 6.
Snapshots of character state features. Eighteen panels are shown as mini-semblances of the bifurcated tree of cohesion groups portrayed in Fig. 2. Various character states of interest are displayed on these trees to facilitate comparisons. The organisms in all three domains of life that host the various TyrA cohesion groups are profiled in panels 1 to 8. The numbers at the branch ends in panels 2 to 8 indicate the total number of sequences within the cohesion group. An appropriate fraction of a given branch is color coded if the cohesion group has a “mixed” membership. Thus, in panel 3, the proximal half of the TyrCG-13 branch is color coded for the nine sequences of the Epsilonproteobacteria. In panel 6, the other (distal) half of the branch is color coded to indicate the nine TyrA sequences from the class Flavobacteria (Bacteroidetes). The locations of cohesion groups containing intruder sequences are identified in panel 9, e.g., the Flavobacteria mentioned above. TyrA character states associated with cofactor and cyclohexadienyl substrate specificities are displayed in accord with the color-coded legends (panels 10 and 11). In panel 10, “?NADP or NAD(P)?” means that whether the enzyme is NADP+ specific or whether it can use either cofactor is unknown, but we know that it cannot be NAD+ specific. The amino acid lengths of trimmed core supradomain TyrA sequences are given at the branch ends of panel 12. TyrA enzymes encoded by tyrA genes fused to other genes are depicted in panel 13. TyrA enzymes encoded by tyrA genes which are isolated from other aromatic pathway genes are shown in panel 15. The color-coded legends for panels 17 and 18 show conserved motifs (Fig. 3), which are disrupted or absent in the indicated cohesion groups (or a fraction thereof). These panels can be accessed at http://theseed.uchicago.edu/FIG/Html/TyrAPanels.html, where they can be expanded and sorted in order to facilitate comparisons. The interactive panels are linked to the extended table in order to quickly view the membership of any cohesion group of interest.
FIG. 7.
FIG. 7.
Independent tyrA-aroF fusions in proteobacterial amino acid sequences of TyrA-AroF fusions from the upper Gammaproteobacteria and the Betaproteobacteria were aligned with TyrA and AroF concatenates from other members of these proteobacterial divisions where these genes are unfused. The alignment was used to obtain the Phylip tree shown. Values of bootstrap support are indicated at nodes. Proteins encoded by tyrA-aroF fusions are enclosed within the orange patterning.
FIG. 8.
FIG. 8.
Tracking milestone evolutionary events in the Actinobacteridae. The dendrogram for the subclass Actinobacteridae of the Bacteria (not drawn to scale) includes the family Bifidobacteriaceae of the order Bifidobacteriales (top) and the various families belonging to the order Actinomycetales. Character states asserted to exist in the common ancestor are indicated by orange encircled letters. More recent evolutionary events are shown as yellow encircled letters.
FIG. 9.
FIG. 9.
Tracking milestone evolutionary events in the group Bacteroidetes/Chlorobi. The dendrogram (not drawn to scale) enumerates character states inferred to be present in the common ancestor of the superphylum at the top. Various evolutionary events affecting genes of the ancestral trp and aro operons are indicated at appropriate lineage positions. At the bottom, the gene organizations of the trp operons and the aro operons present in contemporary classes of the phylum Bacteroidetes are shown.

References

    1. Abou-Zeid, A., G. Euverink, G. I. Hessels, R. A. Jensen, and L. Dijkhuizen. 1995. Biosynthesis of l-phenylalanine and l-tyrosine in the actinomycete Amycolatopsis methanolica. Appl. Environ. Microbiol. 611298-1302. - PMC - PubMed
    1. Afriat, L., C. Roodveldt, G. Manco, and D. S. Tawfik. 2006. The latent promiscuity of newly identified microbial lactonases is linked to a recently diverged phosphotriesterase. Biochemistry 4513677-13686. - PubMed
    1. Aharoni, A., L. Gaidukov, O. Khersonsky, S. M. Gould, C. Roodveldt, and D. S. Tawfik. 2005. The ‘evolvability’ of promiscuous protein functions. Nat. Genet. 3773-76. - PubMed
    1. Ahmad, S., and R. A. Jensen. 1988. The phylogenetic origin of the bifunctional tyrosine-pathway protein in the enteric lineage of bacteria. Mol. Biol. Evol. 5282-297. - PubMed
    1. Ahmad, S., and R. A. Jensen. 1987. The prephenate dehydrogenase component of the bifunctional T-protein in enteric bacteria can utilize L-arogenate. FEBS Lett. 216133-139. - PubMed

Publication types

MeSH terms

LinkOut - more resources