Comparative Study
. 2008 Mar 5;28(10):2551-62.
doi: 10.1523/JNEUROSCI.5497-07.2008.

Early neuronal and glial fate restriction of embryonic neural stem cells

Affiliations
Comparative Study

Early neuronal and glial fate restriction of embryonic neural stem cells

Delphine Delaunay et al. J Neurosci. .

Abstract

The question of how neurons and glial cells are generated during the development of the CNS has over time led to two alternative models: either neuroepithelial cells are capable of giving rise to neurons first and to glial cells at a later stage (switching model), or they are intrinsically committed to generate one or the other (segregating model). Using the developing diencephalon as a model and by selecting a subpopulation of ventricular cells, we analyzed both in vitro, using clonal analysis, and in vivo, using inducible Cre/loxP fate mapping, the fate of neuroepithelial and radial glial cells generated at different time points during embryonic development. We found that, during neurogenic periods [embryonic day 9.5 (E9.5) to 12.5], proteolipid protein (plp)-expressing cells were lineage-restricted neuronal precursors, but later in embryogenesis, during gliogenic periods (E13.5 to early postnatal), plp-expressing cells were lineage-restricted glial precursors. In addition, we show that glial cells forming at E13.5 arise from a new pool of neuroepithelial progenitors distinct from neuronal progenitors cells, which lends support to the segregating model.


Figures
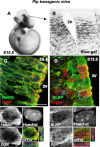
Figure 1.
Figure 1.
Sequential expression of plp by ventricular neuroepithelial and radial glial cells. A, Whole-mount of plp–shble–lacZ embryo stained with bluo-gal at E10.5. The line indicates the plane of section in B. B, Coronal cryostat section of the bpd showing bluo-gal-labeled cells. C, D, Confocal micrographs of single optical slices through cells in the bpd of plp–shble–lacZ embryos at E9.5 and E13.5 that are double stained by immunofluorescence for β-gal and nestin (C) or BLBP (D) and counterstained with Hoechst reagent. Merged images, individual channels, and orthogonal analysis show that all β-gal-expressing cells in the bpd are nestin+ at E9.5 and BLBP+ at E13.5. Orthogonal images (ortho) show three-dimensional analysis of individual cells at specific sites marked by intersecting lines in the x-, y-, and z-axes. 3V, Third ventricle. Scale bar: A, 0.6 mm; B, 45 μm; C, D, 25 μm.
Figure 2.
Figure 2.
plp-expressing ventricular cells give rise to all neural cell populations. A, Whole-mount of plp–CRE;R26R embryo stained with bluo-gal at E10.5. The line indicates the plane of section in B. B, Coronal section across the bpd showing bluo-gal-labeled cells (compare with Fig. 1B). C, Coronal section through the bpd of a plp–CRE;Z/EG at E13.5, double immunostained with GFP and GLAST antibodies showing that all GFP+ cells in the ventricular zone are GLAST+ radial glial cells. D–G, At later stages, plp-activated cells give rise to all four neural cell populations. Confocal micrographs of single optical slices through cells in the bpd of P15 plp–CRE;Z/EG brains double stained by immunofluorescence for GFP and CC1 (D), S100β (E,F), or calretinin (G) and counterstained with Hoechst reagent. Merged images, individual channels, and orthogonal analysis show that plp-activated cells give rise to CC1+ oligodendrocytes (D), S100β+ protoplasmic astrocytes (E), S100β+ ependymal cells (F), and calretinin+ neurons (G). Orthogonal images (ortho) show three-dimensional analysis of individual cells at specific sites marked by intersecting lines in the x-, y-, and z-axes. 3V, Third ventricle. Scale bar: A, 0.6 mm; B, 45 μm; C–G, 25 μm.
Figure 3.
Figure 3.
plp-expressing neural progenitors become glially restricted from E13.5. A, C, Sagittal view of GFP expression in the bpd of plp–GFP embryos at E9.5 (A) and E13.5 (C). B, D, FACS profiles of GFP+ and GFP cells isolated at E9.5 (B) and E13.5 (D). The gates to select positive cells were set compared with diencephalic cells from control wild-type embryos at the same developmental stage. At E9.5, 17% of ventricular cells are GFP+, whereas this number decreases to 8% at E13.5. Purity of the sorted cells, assessed by reanalysis of an aliquot was between 95% (at E13.5) and 98% (at E9.5). E–H, Immunostaining of nondissociated neurospheres (under differentiation conditions) with TuJ1 (E, G) and O4 (F,H) mAbs. Neurospheres derived from E13.5 embryos were unable to generate neurons (G). d, Dorsal, r, rostral. Scale bar: A, 230 μm; C, 1.4 mm; E–H, 140 μm.
Figure 4.
Figure 4.
plp-expressing progenitors are mostly neuronally or glially restricted. A–H, plp–GFP+ cells sorted at E9.5 and E13.5 were cultured at clonal density on an homotypic and homochronic rat feeder layer for 10 DIV and were double immunostained with the M2/M6 mAbs (red) and cell-type-specific markers (green): NeuN (neurons), GFAP (astrocytes), O4 (oligodendrocytes), and BLBP (radial glial cells). Note the M2M6/BLBP double-positive cells (arrowheads), which are contained in a mixed clone together with differentiated neurons (arrows in G,H). Scale bar, 60 μm. I, Quantification of the percentage of pure neuronal, pure glial, and mixed neuron–glial clones obtained after 10 DIV from fluorescence-activated cell-sorted GFP+ cells at E9.5 and E13.5. Number of clones analyzed was 237 at E9.5 and 288 at E13.5.
Figure 5.
Figure 5.
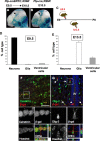
Tamoxifen induction reveals that plp-expressing progenitors are lineage restricted in vivo. A, B, Whole-mount X-gal staining of an E10.5 plp–CreERT2;R26R transgenic treated with tamoxifen at E9.5 (A) compared with an E10.5 plp–Cre;R26R embryo (B). Arrows indicate the bpd. C, Schematic representation of the tamoxifen injection protocol. Tamoxifen was injected into plp–CreERT2;Z/EG or plp–CreERT2;R26R pregnant mice at either E9.5 or E13.5 and analyzed at P0. D, E, Quantification of the percentage of neurons, glia, and ventricular cells obtained at P0 after tamoxifen injection at E9.5 and E13.5. Tamoxifen-injected animals were killed at birth (P0), and their brains were serially sectioned and double stained by immunofluorescence for GFP or β-gal and cell-type-specific markers (calretinin or NeuN for neurons and Olig-2 or S100β for glial cells). F, G, Confocal micrographs of single optical slices through cells in the diencephalon of plp–CreERT2;R26R newborn mouse injected with tamoxifen at E9.5 (F) and E13.5 (G) double stained by immunofluorescence for β-gal and either calretinin (F) or Olig-2 (G) and counterstained with Hoechst reagent. Merged images, individual channels, and orthogonal analysis show that β-gal-expressing cells are calretinin+ and Olig-2+ after tamoxifen injection at E9.5 (F) and E13.5 (G, arrows), respectively. Some β-gal+/Olig-2 cells with a bipolar morphology remain in the ventricular zone (arrowhead in G). Orthogonal images (ortho) show three-dimensional analysis of individual cells at specific sites marked by intersecting lines in the x-, y-, and z-axes. 3V, Third ventricle. Scale bar: A, B, 0.6 mm; F, G, 60 μm.
Figure 6.
Figure 6.
Emergence of CRE+/GFP cells in the ventricular zone of the diencephalon at E13. Coronal cryosections of E9.5 to E14.5 (E13 shown in A–C) plp–CRE;Z/EG bpd were double stained by immunofluorescence for CRE (red) and GFP (green). At all stages analyzed, most CRE+/GFP cells were localized in the ventricular zone (arrows), suggesting that they had begun to express plp shortly before the embryos were fixed. Although CRE+/GFP+ double-positive cells were localized in both the ventricular and subventricular regions, CRE/GFP+ cells were only localized in the marginal regions (arrowheads). Scale bar, 400 μm. D, Quantification of CRE+/GFP, CRE+/GFP+, and CRE/GFP+ cells at each stage suggests that, although CRE+ cells are mostly absent from E11.5 ventricular zone, these cells are predominant in E9.5 and E12.5 diencephalon. Number of embryos analyzed is as follows: n = 6 at E9.5; n = 4 from E10.5 to E13.5; n = 3 at E14.5.
Figure 7.
Figure 7.
Proposed model for the generation of neurons and glia in the bpd. At E9.5, the ventricular zone (VZ) contains plp+ neuronal progenitors cells (green). These neuroblasts can self-renew and give rise to neurons only, which then migrate out of the ventricular zone. The plp+ neuroblasts downregulate plp when they differentiate into neurons (red). At this developmental stage, we propose the existence of glioblasts (purple), which are not yet expressing plp. At E13.5, a new population of plp+ cells appear from glioblasts in the ventricular zone (green and purple) and give rise mostly to glial cells. The plp+ glioblasts will either maintain or downregulate plp expression whether they differentiate into oligodendrocytes (green cells) or astrocytes (purple cells), respectively.

References

    1. Anderson DJ. Stem cells and pattern formation in the nervous system: the possible versus the actual. Neuron. 2001;30:19–35. - PubMed
    1. Battiste J, Helms AW, Kim EJ, Savage TK, Lagace DC, Mandyam CD, Eisch AJ, Miyoshi G, Johnson JE. Ascl1 defines sequentially generated lineage-restricted neuronal and oligodendrocyte precursor cells in the spinal cord. Development. 2007;134:285–293. - PubMed
    1. Bellefroid EJ, Bourguignon C, Hollemann T, Ma Q, Anderson DJ, Kintner C, Pieler T. X-MyT1, a Xenopus C2HC-type zinc finger protein with a regulatory function in neuronal differentiation. Cell. 1996;87:1191–1202. - PubMed
    1. Bertrand N, Castro DS, Guillemot F. Proneural genes and the specification of neural cell types. Nat Rev Neurosci. 2002;3:517–530. - PubMed
    1. Bhat RV, Axt KJ, Fosnaugh JS, Smith KJ, Johnson KA, Hill DE, Kinzler KW, Baraban JM. Expression of the APC tumor suppressor protein in oligodendroglia. Glia. 1996;17:169–174. - PubMed

Publication types

LinkOut - more resources