. 2008 Jun;18(6):918-29.
doi: 10.1101/gr.070169.107. Epub 2008 Mar 6.

Detecting polymorphic regions in Arabidopsis thaliana with resequencing microarrays

Affiliations

Detecting polymorphic regions in Arabidopsis thaliana with resequencing microarrays

Georg Zeller et al. Genome Res. 2008 Jun.

Abstract

Whole-genome oligonucleotide resequencing arrays have allowed the comprehensive discovery of single nucleotide polymorphisms (SNPs) in eukaryotic genomes of moderate to large size. With this technology, the detection rate for isolated SNPs is typically high. However, it is greatly reduced when other polymorphisms are located near a SNP as multiple mismatches inhibit hybridization to arrayed oligonucleotides. Contiguous tracts of suppressed hybridization therefore typify polymorphic regions (PRs) such as clusters of SNPs or deletions. We developed a machine learning method, designated margin-based prediction of polymorphic regions (mPPR), to predict PRs from resequencing array data. Conceptually similar to hidden Markov models, the method is trained with discriminative learning techniques related to support vector machines, and accurately identifies even very short polymorphic tracts (<10 bp). We applied this method to resequencing array data previously generated for the euchromatic genomes of 20 strains (accessions) of the best-characterized plant, Arabidopsis thaliana. Nonredundantly, 27% of the genome was included within the boundaries of PRs predicted at high specificity ( approximately 97%). The resulting data set provides a fine-scale view of polymorphic sequences in A. thaliana; patterns of polymorphism not apparent in SNP data were readily detected, especially for noncoding regions. Our predictions provide a valuable resource for evolutionary genetic and functional studies in A. thaliana, and our method is applicable to similar data sets in other species. More broadly, our computational approach can be applied to other segmentation tasks related to the analysis of genomic variation.


Figures

Figure 1.
Figure 1.
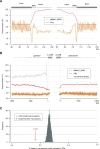
Effect of polymorphisms on hybridization patterns, labels for the mPPR algorithm, and polymorphic predictions. (A) Log2 intensities for oligonucleotides in a 56-bp tiling path (chromosome 4, positions 8,375,747–8,375,802) for the reference Col-0 accession. Intensities for each sequence (see inset) are given and are averages for the forward and reverse strand features tiled on the arrays (see Methods). (B) Corresponding data from accession Cvi-0 for which three SNPs and a 3-bp deletion are present relative to the tiled Col-0 reference sequence. Intensities are suppressed flanking an isolated SNP (right), where the SNP probe shows a clear peak, and intensities for all probes are reduced for the cluster of three polymorphisms, including the deletion (left center). (C) Log2 intensities for the maximally hybridizing oligonucleotide at each tiled position are shown for Col-0 and Bor-4 (see inset) for a particularly challenging sequence fragment in 2010 (chromosome 3, positions 10,245,203–10,245,702; gene AT3G27660). Hybridization properties for much of the region are poor, as reflected by the low intensity values for the perfect match Col-0 reference sequence. Known (2010) and predicted polymorphisms (MBML2) for Bor-4 are as indicated. Only two of the 21 known Bor-4 polymorphisms (17 of which are SNPs) were predicted in MBML2. (D) The corresponding polymorphic region (PR) label sequence for Bor-4 and resulting PR predictions (color coding is as shown at bottom). Light gray shading that extends across panels C and D corresponds to PR labels (red). Plotted data are from Nordborg et al. (2005) and Clark et al. (2007).
Figure 2.
Figure 2.
Relationship between specificity and sensitivity for PR predictions with overlap criteria λ = 75%. (A) Specificity–sensitivity curves averaged over cross-validation test subsets for different sequence types (for color code, see inset). PRs that contained more than one sequence type were assigned to the type comprising the majority of the prediction. (B) Specificity at the nucleotide level as calculated for each position within a prediction. Deleted nucleotides and SNP positions were assigned a distance of 0. A cumulative histogram of these distances is displayed, showing that, e.g., more than 90% of all nucleotides in PR predictions are within six nucleotides to a known polymorphism. The dotted black line indicates the relationship expected by chance (i.e., predictions were assigned to random genomic locations for calculating distances).
Figure 3.
Figure 3.
Dependency of SNP sensitivity on distance between polymorphisms by detection method. SNPs were partitioned according to the distance to the nearest polymorphism. The frequency of SNPs in each distance bin (X-axis) is shown as bars. Sensitivity rates per distance category are given for MBML2 SNP calls (circles) and inclusion within PR prediction boundaries (crosses).
Figure 4.
Figure 4.
PRs reveal haplotype sharing at chromosomal and local scales. (A) Genes (top) and PRs (gray blocks beneath) for five accessions for 0.8 Mb surrounding the FRI locus. In Est-1 a region of ∼0.6 Mb (dashed black box) including FRI (vertical line) has been reported to be nearly identical to the Col-0 reference sequence but divergent in the other accessions shown (Nordborg et al. 2005; Clark et al. 2007). Only several PRs are located in the Est-1 region that is monomorphic with the tiled reference sequence. (B) Pattern of PRs for 8 kb at the RPM1 locus. The location of a 3.7-kb deletion that segregates in the A. thaliana population is as indicated at bottom (Grant et al. 1995, Shen et al. 2006). Experimental characterization revealed that the C24, Cvi-0, and RRS-10 accessions included in the current study harbored this deletion (the other accessions shown have a Col-0 like haplotype). PRs delineate the deletion as well as flanking SNPs and indels (see also Supplemental Fig. S6).
Figure 5.
Figure 5.
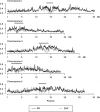
Genome-wide patterns of polymorphism in PRs and MBML2 SNPs. A sliding window of 100 kb was used, with values for every 10,000th position plotted. The Y-axis displays the fraction of bp in each window included within PRs nonredundantly over all accessions (black line), and the two measures of polymorphism are broadly correlated (Supplemental Fig. S7). To facilitate visualization, the analogous measure for the SNP data was multiplied by 50 (gray line). Thick gray bars indicate the approximate positions of centromeres as defined by repeat content in an earlier study (Clark et al. 2007).
Figure 6.
Figure 6.
Patterns of polymorphism apparent in PR and SNP data in noncoding regions. (A) Polymorphism near splice donor (left) and splice acceptor (right) sites as averaged over 116,971 splice sites and assessed with both the PR prediction and MBML2 (SNP) data sets (for details of polymorphism estimation, see inset; Supplemental Methods). Relaxed constraint at wobble positions is apparent in the SNP data as sequential peaks in polymorphism with a 3-bp offset (the observed pattern reflects, in part, biased splicing at codon boundaries). SNP polymorphism is lowest at splice sites, and polymorphism estimates with the PR and SNP data diverge for intronic sequences (middle). (B) Comparison of the PR and SNP polymorphism estimates for the 1000 bp located 5′ and 3′ to transcription units for coding genes (averaged across 17,434 genes with annotated 5′ UTRs, and 17,430 genes with annotated 3′ UTRs). The average density of predicted cis-elements for the 5′ region is as shown. A peak immediately 5′ to transcription start sites corresponds to the TATA motif. (C) Percentage overlap of PRs to cis-element motifs mapped to the A. thaliana genome for 9599 upstream regions for Bor-4 (red arrow) (for overlap in other accessions, see Supplemental Fig. S8). The overlap expected by chance was established by permuting PRs and upstream regions 1000 times (gray shading; see Supplemental Methods).
Figure 7.
Figure 7.
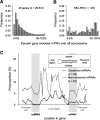
Percentage of coding and miRNA genes included in PRs over all accessions by gene category. (A, B) Distribution of coding genes as a function of percentage inclusion in PRs for all genes and NB-LRR genes, respectively (see Supplemental Methods). (C) Polymorphism averaged over conserved and nonconserved miRNA genes by location in the stem–loop structure (inset and as labeled at bottom). To facilitate visualization, lengths of the stem-loops were scaled relative to each other as described in the Methods.

References

    1. Alonso J., Ecker J., Ecker J. Moving forward in reverse: Genetic technologies to enable genome-wide phenomic screens in Arabidopsis. Nat. Rev. Genet. 2006;7:524–536. - PubMed
    1. Altun Y., Tsochantaridis I., Hofmann T., Tsochantaridis I., Hofmann T., Hofmann T. Proceedings of the 20th International Conference on Machine Learning. AAAI Press; Menlo Park, CA: 2003. Hidden Markov support vector machines; pp. 3–10.
    1. The Arabidopsis Genome Initiative Analysis of the genome sequence of the flowering plant Arabidopsis thaliana. Nature. 2000;408:796–815. - PubMed
    1. Bakker E., Toomajian C., Kreitman M., Bergelson J., Toomajian C., Kreitman M., Bergelson J., Kreitman M., Bergelson J., Bergelson J. A genome-wide survey of R gene polymorphisms in Arabidopsis. Plant Cell. 2006;18:1803–1818. - PMC - PubMed
    1. Bernal A., Crammer K., Hatzigeorgiou A., Pereira F., Crammer K., Hatzigeorgiou A., Pereira F., Hatzigeorgiou A., Pereira F., Pereira F. Global discriminative learning for higher-accuracy computational gene prediction. PLoS Comput. Biol. 2007;3:e54. doi: 10.1371/journal.pcbi.0030054. - DOI - PMC - PubMed

Publication types

LinkOut - more resources