Protein-aptamer binding studies using microchip affinity capillary electrophoresis
- PMID: 18324729
- PMCID: PMC3529586
- DOI: 10.1002/elps.200700777
Protein-aptamer binding studies using microchip affinity capillary electrophoresis
Abstract
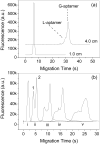
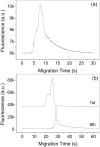
The use of traditional CE to detect weak binding complexes is problematic due to the fast-off rate resulting in the dissociation of the complex during the separation process. Additionally, proteins involved in binding interactions often nonspecifically stick to the bare-silica capillary walls, which further complicates the binding analysis. Microchip CE allows flexibly positioning the detector along the separation channel and conveniently adjusting the separation length. A short separation length plus a high electric field enables rapid separations thus reducing both the dissociation of the complex and the amount of protein loss due to nonspecific adsorption during the separation process. Thrombin and a selective thrombin-binding aptamer were used to demonstrate the capability of microchip CE for the study of relatively weak binding systems that have inherent limitations when using the migration shift method or other CE methods. The rapid separation of the thrombin-aptamer complex from the free aptamer was achieved in less than 10 s on a single-cross glass microchip with a relatively short detection length (1.0 cm) and a high electric field (670 V/cm). The dissociation constant was determined to be 43 nM, consistent with reported results. In addition, aptamer probes were used for the quantitation of standard thrombin samples by constructing a calibration curve, which showed good linearity over two orders of magnitude with an LOD for thrombin of 5 nM at a three-fold S/N.
Figures


Similar articles
-
Poly(methyl methacrylate) microchip affinity capillary gel electrophoresis of aptamer-protein complexes for the analysis of thrombin in plasma.Electrophoresis. 2008 Aug;29(16):3436-45. doi: 10.1002/elps.200700854. Electrophoresis. 2008. PMID: 18702051
-
Frontal analysis in microchip CE: a simple and accurate method for determination of protein-DNA dissociation constant.Electrophoresis. 2007 Mar;28(5):837-42. doi: 10.1002/elps.200600398. Electrophoresis. 2007. PMID: 17315151 Free PMC article.
-
A simple and rapid approach for measurement of dissociation constants of DNA aptamers against proteins and small molecules via automated microchip electrophoresis.Analyst. 2011 Sep 7;136(17):3461-8. doi: 10.1039/c0an00842g. Epub 2011 Feb 3. Analyst. 2011. PMID: 21293790
-
[Advances in microchip electrophoresis for the separation and analysis of biological samples].Se Pu. 2023 Aug;41(8):641-650. doi: 10.3724/SP.J.1123.2022.12004. Se Pu. 2023. PMID: 37534551 Free PMC article. Review. Chinese.
-
Microchip capillary electrophoresis: application to peptide analysis.Methods Mol Biol. 2006;339:159-86. doi: 10.1385/1-59745-076-6:159. Methods Mol Biol. 2006. PMID: 16790873 Review.
Cited by
-
Methods for measuring aptamer-protein equilibria: a review.Anal Chim Acta. 2011 Feb 7;686(1-2):9-18. doi: 10.1016/j.aca.2010.10.032. Epub 2010 Nov 10. Anal Chim Acta. 2011. PMID: 21237304 Free PMC article. Review.
-
Microchip immunoaffinity electrophoresis of antibody-thymidine kinase 1 complex.Electrophoresis. 2015 Mar;36(5):813-7. doi: 10.1002/elps.201400436. Epub 2015 Feb 3. Electrophoresis. 2015. PMID: 25486911 Free PMC article.
-
Aptamer-Based Sensing of Small Organic Molecules by Measuring Levitation Coordinate of Single Microsphere in Combined Acoustic-Gravitational Field.ACS Omega. 2020 Feb 11;5(7):3542-3549. doi: 10.1021/acsomega.9b03860. eCollection 2020 Feb 25. ACS Omega. 2020. PMID: 32118169 Free PMC article.
-
Ribonucleotide and ribonucleoside determination by ambient pressure ion mobility spectrometry.Anal Chim Acta. 2010 Jan 18;658(1):91-7. doi: 10.1016/j.aca.2009.10.058. Epub 2009 Oct 31. Anal Chim Acta. 2010. PMID: 20082780 Free PMC article.
-
Demonstration and Characterization of Biomolecular Enrichment on Microfluidic Aptamer-Functionalized Surfaces.Sens Actuators B Chem. 2011 Jul 5;155(1):58-66. doi: 10.1016/j.snb.2010.11.024. Sens Actuators B Chem. 2011. PMID: 21765612 Free PMC article.
References
-
- Khandurina J, Guttman A. J Chromatogr A. 2002;943:159–183. - PubMed
-
- Lion N, Rohner TC, Dayon L, Arnaud IL, Damoc E, Youhnovski N, Wu ZY, Roussel C, Josserand J, Jensen H, Rossier J, Przybylski M, Girault HH. Electrophoresis. 2003;24:3533–3562. - PubMed
-
- Dolnik V, Liu S. J Sep Sci. 2005;28:1994–2009. - PubMed
-
- Gao Q, Shi Y, Liu S. Fresen J Anal Chem. 2001;371:137–145. - PubMed
-
- Becker H, Gärtner C. Electrophoresis. 2000;21:12–26. - PubMed
Publication types
MeSH terms
Substances
Grants and funding
LinkOut - more resources
Full Text Sources

