. 2008;12(2):R37.
doi: 10.1186/cc6822. Epub 2008 Mar 6.

Ability of pleth variability index to detect hemodynamic changes induced by passive leg raising in spontaneously breathing volunteers

Affiliations

Ability of pleth variability index to detect hemodynamic changes induced by passive leg raising in spontaneously breathing volunteers

Geoffray Keller et al. Crit Care. 2008.

Abstract

Introduction: Pleth Variability Index (PVI) is a new algorithm that allows continuous and automatic estimation of respiratory variations in the pulse oximeter waveform amplitude. Our aim was to test its ability to detect changes in preload induced by passive leg raising (PLR) in spontaneously breathing volunteers.

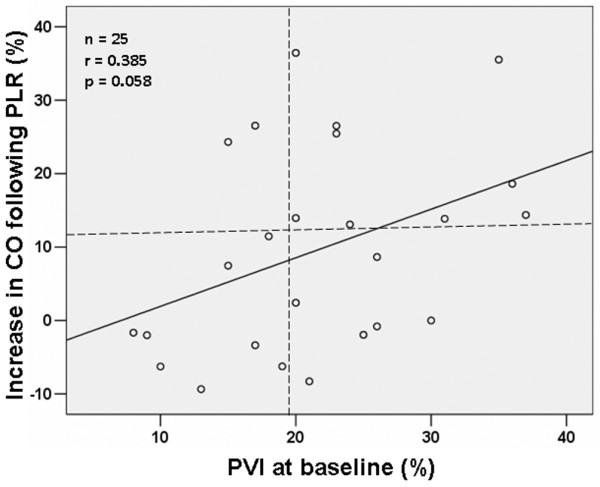
Methods: We conducted a prospective observational study. Twenty-five spontaneously breathing volunteers were enrolled. PVI, heart rate and noninvasive arterial pressure were recorded. Cardiac output was assessed using transthoracic echocardiography. Volunteers were studied in three successive positions: baseline (semirecumbent position); after PLR of 45 degrees with the trunk lowered in the supine position; and back in the semirecubent position.

Results: We observed significant changes in cardiac output and PVI during changes in body position. In particular, PVI decreased significantly from baseline to PLR (from 21.5 +/- 8.0% to 18.3 +/- 9.4%; P < 0.05) and increased significantly from PLR to the semirecumbent position (from 18.3 +/- 9.4% to 25.4 +/- 10.6 %; P < 0.05). A threshold PVI value above 19% was a weak but significant predictor of response to PLR (sensitivity 82%, specificity 57%, area under the receiver operating characteristic curve 0.734 +/- 0.101).

Conclusion: PVI can detect haemodynamic changes induced by PLR in spontaneously breathing volunteers. However, we found that PVI was a weak predictor of fluid responsiveness in this setting.


Figures

Figure 1
Figure 1
Study protocol. A first set of measurements was taken with volunteers in the semirecumbent position (45°; baseline1 position), when volunteers were quietly and spontaneously breathing after 5 minutes of rest. Then, the lower limbs were lifted straight (45°) with the trunk lowered in the supine position (passive leg raising [PLR] position), and volunteers were left in this position for 5 minutes. A second set of measurements was obtained 3 minutes after leg elevation. We chose not to record data after 1 minute after PLR because we observed significant artefacts in the pulse oximeter waveforms that cast doubt on any interpretation. A third set of measurements was recorded after 5 minutes rest in the semirecumbent position, as in the baseline1 position (baseline2 position). Responders to volume expansion induced by PLR were defined as those volunteers exhibited more than 12.5% [13] increase in cardiac output after PLR.
Figure 2
Figure 2
Changes in perfusion index during changes in body position. PLR, passive leg raising.
Figure 3
Figure 3
Changes in PVI after changes in body position. PLR, passive leg raising; PVI, Pleth Variability Index.
Figure 4
Figure 4
Evolution in PI and PVI. Shown is the volution in Perfusion Index (PI) and Pleth Variability Index (PVI) during changes in body position over a 15-minute period in an illustrative volunteer. Also shown (at the bottom of the figure) are the raw plethysmographic waveforms at baseline1, passive leg raising (PLR), and baseline2. We observed an increase in PI after PLR and a decrease in PI as the volunteer was positioned in the semirecumbent position (baseline 2; see arrows). At the same time, we observed inverse changes in PVI. Specifically, PVI exhibited a slight increase during PLR that was related to a signal artefact in PI. Raw plethysmographic waveforms corroborate PVI values.
Figure 5
Figure 5
Relationship between PVI at baseline1 and percentage change in CO after PLR. There was non significant relationship between Pleth Variability Index (PVI) at baseline and percentage change in cardiac output (CO) after passive leg raising (PLR). Horizontal dashed line shows increase in CO of 12.5%. Vertical dashed line shows PVI value of 19%, which allowed discrimination between responders and nonresponders to PLR with a sensitivity of 82% and a specificity of 57%.

References

    1. Michard F, Teboul JL. Predicting fluid responsiveness in ICU patients. A critical analysis of the evidence. Chest. 2002;121:2000–2008. doi: 10.1378/chest.121.6.2000. - DOI - PubMed
    1. Cannesson M, Attof Y, Rosamel P, Desebbe O, Joseph P, Metton O, Bastien O, Lehot JJ. Respiratory variations in pulse oximetry plethysmographic waveform amplitude to predict fluid responsiveness in the operating room. Anesthesiology. 2007;106:1105–1111. doi: 10.1097/01.anes.0000267593.72744.20. - DOI - PubMed
    1. Michard F, Boussat S, Chemla D, Anguel N, Mercat A, Lecarpentier Y, Richard C, Pinsky MR, Teboul JL. Relation between respiratory changes in arterial pulse pressure and fluid responsiveness in septic patients with acute circulatory failure. Am J Respir Crit Care Med. 2000;162:134–138. - PubMed
    1. Feissel M, Michard F, Mangin I, Ruyer O, Faller JP, Teboul JL. Respiratory changes in aortic blood velocity as an indicator of fluid responsiveness in ventilated patients with septick shock. Chest. 2001;119:867–873. doi: 10.1378/chest.119.3.867. - DOI - PubMed
    1. Tavernier B, Makhotine O, Lebuffe G, Dupont J, Scherpereel P. Systolic pressure variation as a guide to fluid therapy in patients with sepsis-induced hypotension. Anesthesiology. 1998;89:1313–1321. doi: 10.1097/00000542-199812000-00007. - DOI - PubMed