

The evolution of human influenza A viruses from 1999 to 2006: a complete genome study
- PMID: 18325125
- PMCID: PMC2311284
- DOI: 10.1186/1743-422X-5-40
The evolution of human influenza A viruses from 1999 to 2006: a complete genome study
Abstract
Background: Knowledge about the complete genome constellation of seasonal influenza A viruses from different countries is valuable for monitoring and understanding of the evolution and migration of strains. Few complete genome sequences of influenza A viruses from Europe are publicly available at the present time and there have been few longitudinal genome studies of human influenza A viruses. We have studied the evolution of circulating human H3N2, H1N1 and H1N2 influenza A viruses from 1999 to 2006, we analysed 234 Danish human influenza A viruses and characterised 24 complete genomes.
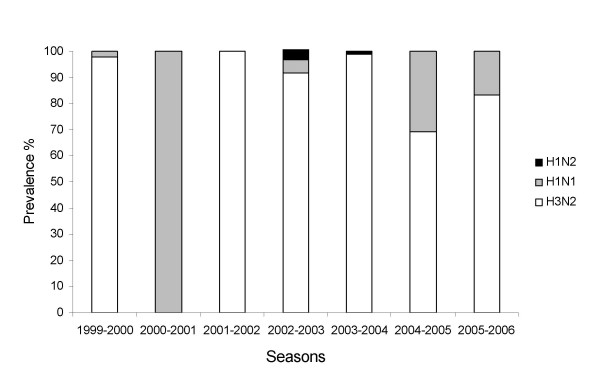
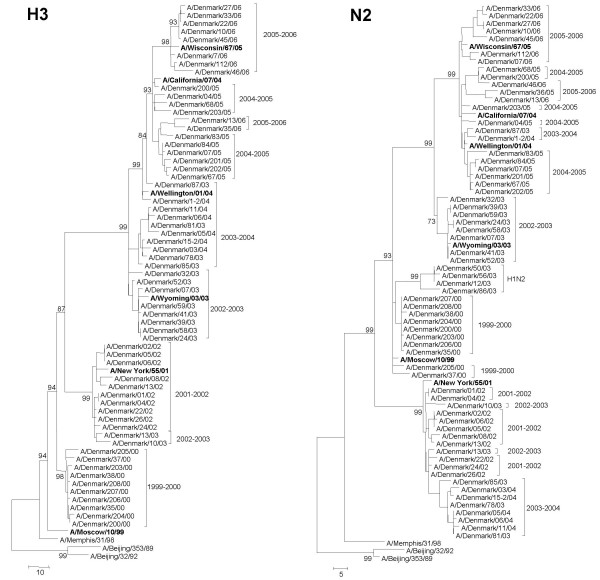
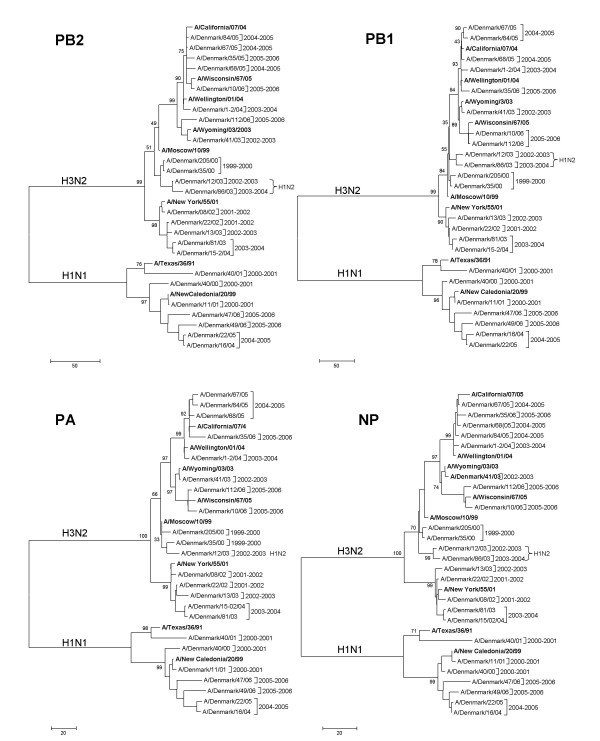
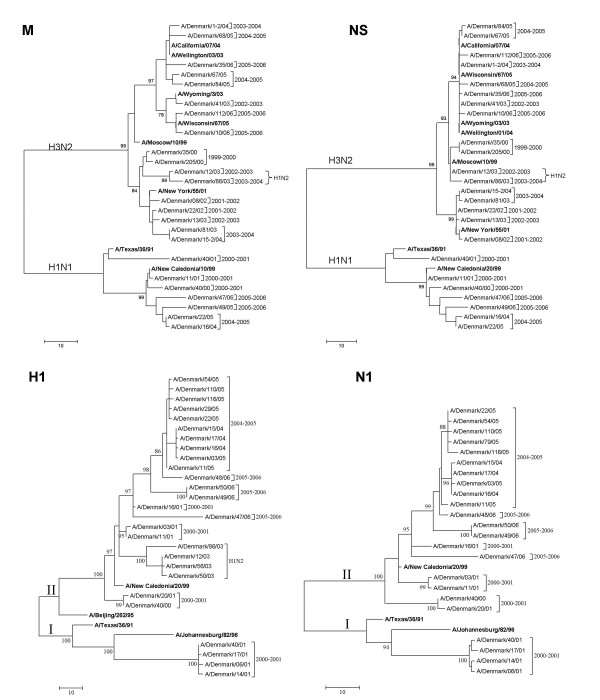
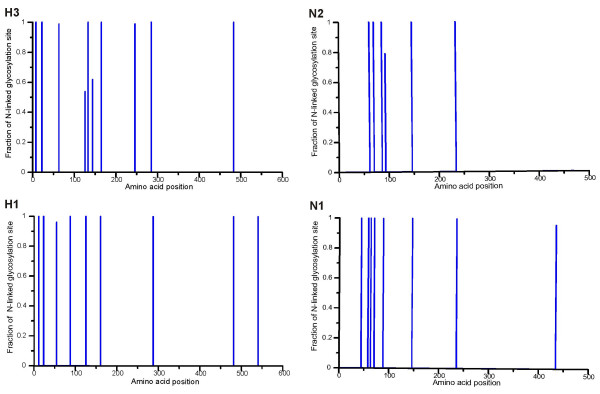
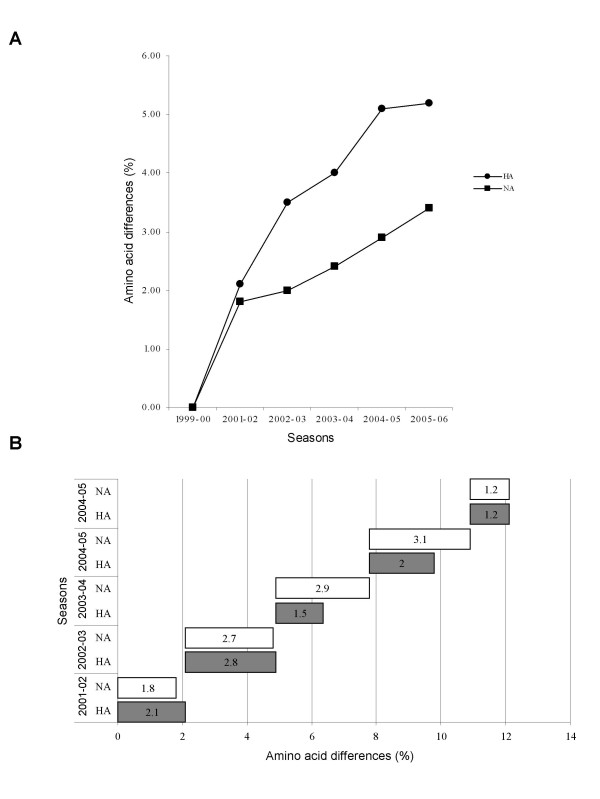
Results: H3N2 was the prevalent strain in Denmark during the study period, but H1N1 dominated the 2000-2001 season. H1N2 viruses were first observed in Denmark in 2002-2003. After years of little genetic change in the H1N1 viruses the 2005-2006 season presented H1N1 of greater variability than before. This indicates that H1N1 viruses are evolving and that H1N1 soon is likely to be the prevalent strain again. Generally, the influenza A haemagglutinin (HA) of H3N2 viruses formed seasonal phylogenetic clusters. Different lineages co-circulating within the same season were also observed. The evolution has been stochastic, influenced by small "jumps" in genetic distance rather than constant drift, especially with the introduction of the Fujian-like viruses in 2002-2003. Also evolutionary stasis-periods were observed which might indicate well fit viruses. The evolution of H3N2 viruses have also been influenced by gene reassortments between lineages from different seasons. None of the influenza genes were influenced by strong positive selection pressure. The antigenic site B in H3N2 HA was the preferred site for genetic change during the study period probably because the site A has been masked by glycosylations. Substitutions at CTL-epitopes in the genes coding for the neuraminidase (NA), polymerase acidic protein (PA), matrix protein 1 (M1), non-structural protein 1 (NS1) and especially the nucleoprotein (NP) were observed. The N-linked glycosylation pattern varied during the study period and the H3N2 isolates from 2004 to 2006 were highly glycosylated with ten predicted sequons in HA, the highest amount of glycosylations observed in this study period.
Conclusion: The present study is the first to our knowledge to characterise the evolution of complete genomes of influenza A H3N2, H1N1 and H1N2 isolates from Europe over a time period of seven years from 1999 to 2006. More precise knowledge about the circulating strains may have implications for predicting the following season strains and thereby better matching the vaccine composition.
Figures
References
-
- Paget WJ, Meerhoff TJ, Goddard NL. Mild to moderate influenza activity in Europe and the detection of novel A(H1N2) and B viruses during the winter of 2001-02. Euro Surveill. 2002;7:147–157. - PubMed
MeSH terms
Substances
Associated data
- Actions
- Actions
- Actions
- Actions
- Actions
- Actions
- Actions
- Actions
- Actions
- Actions
- Actions
- Actions
- Actions
- Actions
- Actions
- Actions
- Actions
- Actions
- Actions
- Actions
- Actions
- Actions
- Actions
- Actions
- Actions
- Actions
- Actions
- Actions
- Actions
- Actions
- Actions
- Actions
- Actions
- Actions
- Actions
- Actions
- Actions
- Actions
- Actions
- Actions
- Actions
- Actions
- Actions
- Actions
- Actions
- Actions
- Actions
- Actions
- Actions
- Actions
- Actions
- Actions
- Actions
- Actions
- Actions
- Actions
- Actions
- Actions
- Actions
- Actions
- Actions
- Actions
- Actions
- Actions
- Actions
- Actions
- Actions
- Actions
- Actions
- Actions
- Actions
- Actions
- Actions
- Actions
- Actions
- Actions
- Actions
- Actions
- Actions
- Actions
- Actions
- Actions
- Actions
- Actions
- Actions
- Actions
- Actions
- Actions
- Actions
- Actions
- Actions
- Actions
- Actions
- Actions
- Actions
- Actions
- Actions
- Actions
- Actions
- Actions
- Actions
- Actions
- Actions
- Actions
- Actions
- Actions
- Actions
- Actions
- Actions
- Actions
- Actions
- Actions
- Actions
- Actions
- Actions
- Actions
- Actions
- Actions
- Actions
- Actions
- Actions
- Actions
- Actions
- Actions
- Actions
- Actions
- Actions
- Actions
- Actions
- Actions
- Actions
- Actions
- Actions
- Actions
- Actions
- Actions
- Actions
- Actions
- Actions
- Actions
- Actions
- Actions
- Actions
- Actions
- Actions
- Actions
- Actions
- Actions
- Actions
- Actions
- Actions
- Actions
- Actions
- Actions
- Actions
- Actions
- Actions
- Actions
- Actions
- Actions
- Actions
- Actions
- Actions
- Actions
- Actions
- Actions
- Actions
- Actions
- Actions
- Actions
- Actions
- Actions
- Actions
- Actions
- Actions
- Actions
- Actions
- Actions
- Actions
- Actions
- Actions
- Actions
- Actions
- Actions
- Actions
- Actions
- Actions
- Actions
- Actions
- Actions
- Actions
- Actions
- Actions
- Actions
- Actions
- Actions
- Actions
- Actions
- Actions
- Actions
- Actions
- Actions
- Actions
- Actions
- Actions
- Actions
- Actions
- Actions
- Actions
- Actions
- Actions
- Actions
- Actions
- Actions
- Actions
- Actions
- Actions
- Actions
- Actions
- Actions
- Actions
- Actions
- Actions
- Actions
- Actions
- Actions
- Actions
- Actions
- Actions
- Actions
- Actions
- Actions
- Actions
- Actions
- Actions
- Actions
- Actions
- Actions
- Actions
- Actions
- Actions
- Actions
- Actions
- Actions
- Actions
- Actions
- Actions
- Actions
- Actions
- Actions
- Actions
- Actions
- Actions
- Actions
- Actions
- Actions
- Actions
- Actions
- Actions
- Actions
- Actions
- Actions
- Actions
- Actions
- Actions
- Actions
- Actions
- Actions
- Actions
- Actions
- Actions
- Actions
- Actions
- Actions
- Actions
- Actions
- Actions
- Actions
- Actions
- Actions
- Actions
- Actions
- Actions
- Actions
- Actions
- Actions
- Actions
- Actions
- Actions
- Actions
- Actions
- Actions
- Actions
- Actions
- Actions
- Actions
- Actions
- Actions
- Actions
- Actions
- Actions
- Actions
- Actions
- Actions
- Actions
- Actions
- Actions
- Actions
- Actions
- Actions
- Actions
- Actions
- Actions
- Actions
- Actions
- Actions
- Actions
- Actions
- Actions
- Actions
- Actions
- Actions
- Actions
- Actions
- Actions
- Actions
- Actions
- Actions
- Actions
- Actions
- Actions
- Actions
- Actions
- Actions
- Actions
- Actions
- Actions
- Actions
- Actions
- Actions
- Actions
- Actions
- Actions
- Actions
- Actions
- Actions
- Actions
- Actions
- Actions
- Actions
- Actions
- Actions
- Actions
- Actions
- Actions
- Actions
- Actions
- Actions
- Actions
- Actions
- Actions
- Actions
- Actions
- Actions
- Actions
- Actions
- Actions
- Actions
- Actions
- Actions
- Actions
- Actions
- Actions
- Actions
- Actions
- Actions
- Actions
- Actions
- Actions
- Actions
- Actions
- Actions
- Actions
- Actions
- Actions
- Actions
- Actions
- Actions
- Actions
- Actions
- Actions
- Actions
- Actions
- Actions
- Actions
- Actions
- Actions
- Actions
- Actions
- Actions
- Actions
- Actions
- Actions
- Actions
- Actions
- Actions
- Actions
- Actions
- Actions
- Actions
- Actions
- Actions
- Actions
- Actions
- Actions
- Actions
- Actions
- Actions
- Actions
- Actions
- Actions
- Actions
- Actions
- Actions
- Actions
- Actions
- Actions
- Actions
- Actions
- Actions
- Actions
- Actions
- Actions
- Actions
- Actions
- Actions
- Actions
- Actions
- Actions
- Actions
- Actions
- Actions
- Actions
- Actions
- Actions
- Actions
- Actions
- Actions
- Actions
- Actions
- Actions
- Actions
- Actions
- Actions
- Actions
- Actions
- Actions
- Actions
- Actions
- Actions
- Actions
- Actions
- Actions
- Actions
- Actions
- Actions
- Actions
- Actions
- Actions
- Actions
- Actions
- Actions
- Actions
- Actions
- Actions
- Actions
- Actions
- Actions
- Actions
- Actions
- Actions
- Actions
- Actions
- Actions
- Actions
- Actions
- Actions
- Actions
- Actions
- Actions
- Actions
- Actions
- Actions
- Actions
- Actions
- Actions
- Actions
- Actions
- Actions
- Actions
- Actions
- Actions
- Actions
- Actions
- Actions
- Actions
- Actions
- Actions
- Actions
- Actions
- Actions
- Actions
- Actions
- Actions
- Actions
- Actions
- Actions
- Actions
- Actions
- Actions
- Actions
- Actions
- Actions
- Actions
- Actions
- Actions
- Actions
- Actions
- Actions
- Actions
- Actions
- Actions
- Actions
- Actions
- Actions
- Actions
- Actions
- Actions
- Actions
- Actions
- Actions
- Actions
- Actions
- Actions
- Actions
- Actions
- Actions
- Actions
- Actions
- Actions
- Actions
- Actions
- Actions
- Actions
- Actions
- Actions
- Actions
- Actions
- Actions
- Actions
- Actions
- Actions
- Actions
- Actions
- Actions
- Actions
- Actions
- Actions
- Actions
- Actions
- Actions
- Actions
- Actions
- Actions
- Actions
- Actions
- Actions
- Actions
- Actions
- Actions
- Actions
- Actions
- Actions
- Actions
- Actions
- Actions
- Actions
- Actions
- Actions
- Actions
- Actions
- Actions
- Actions
- Actions
- Actions
- Actions
- Actions
- Actions
- Actions
- Actions
- Actions
- Actions
- Actions
- Actions
- Actions
- Actions
- Actions
- Actions
- Actions
- Actions
- Actions
- Actions
- Actions
- Actions
- Actions
- Actions
- Actions
- Actions
- Actions
- Actions
- Actions
- Actions
- Actions
- Actions
- Actions
- Actions
- Actions
- Actions
- Actions
- Actions
- Actions
- Actions
- Actions
- Actions
LinkOut - more resources
Full Text Sources
Other Literature Sources
Medical
Research Materials
Miscellaneous
