

Functional requirement for Orai1 in store-operated TRPC1-STIM1 channels
- PMID: 18326500
- PMCID: PMC2442339
- DOI: 10.1074/jbc.C800008200
Functional requirement for Orai1 in store-operated TRPC1-STIM1 channels
Abstract
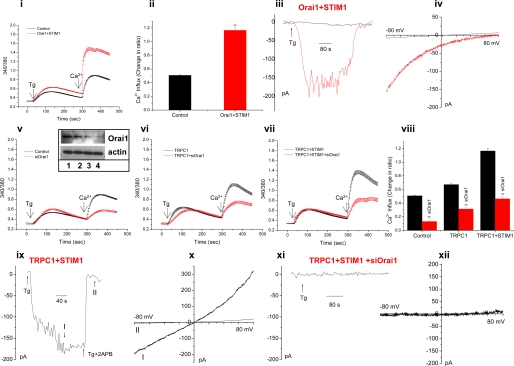
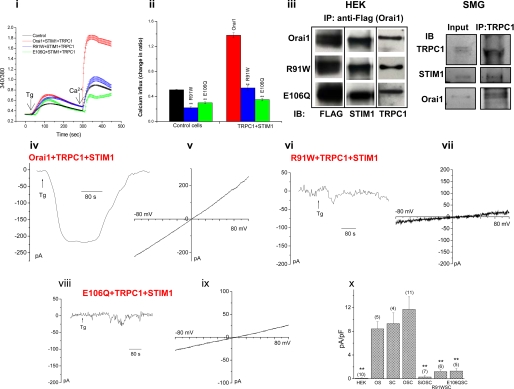
Orai1 and TRPC1 have been proposed as core components of store-operated calcium release-activated calcium (CRAC) and store-operated calcium (SOC) channels, respectively. STIM1, a Ca(2+) sensor protein in the endoplasmic reticulum, interacts with and mediates store-dependent regulation of both channels. We have previously reported that dynamic association of Orai1, TRPC1, and STIM1 is involved in activation of store-operated Ca(2+) entry (SOCE) in salivary gland cells. In this study, we have assessed the molecular basis of TRPC1-SOC channels in HEK293 cells. We report that TRPC1+STIM1-dependent SOCE requires functional Orai1. Thapsigargin stimulation of cells expressing Orai1+STIM1 increased Ca(2+) entry and activated typical I(CRAC) current. STIM1 alone did not affect SOCE, whereas expression of Orai1 induced a decrease. Expression of TRPC1 induced a small increase in SOCE, which was greatly enhanced by co-expression of STIM1. Thapsigargin stimulation of cells expressing TRPC1+STIM1 activated a non-selective cation current, I(SOC), that was blocked by 1 microm Gd(3+) and 2-APB. Knockdown of Orai1 decreased endogenous SOCE as well as SOCE with TRPC1 alone. siOrai1 also significantly reduced SOCE and I(SOC) in cells expressing TRPC1+STIM1. Expression of R91WOrai1 or E106QOrai1 induced similar attenuation of TRPC1+STIM1-dependent SOCE and I(SOC), whereas expression of Orai1 with TRPC1+STIM1 resulted in SOCE that was larger than that with Orai1+STIM1 or TRPC1+STIM1 but not additive. Additionally, Orai1, E106QOrai1, and R91WOrai1 co-immunoprecipitated with similar levels of TRPC1 and STIM1 from HEK293 cells, and endogenous TRPC1, STIM1, and Orai1 were co-immunoprecipitated from salivary glands. Together, these data demonstrate a functional requirement for Orai1 in TRPC1+STIM1-dependent SOCE.
Figures
Similar articles
-
Local Ca²+ entry via Orai1 regulates plasma membrane recruitment of TRPC1 and controls cytosolic Ca²+ signals required for specific cell functions.PLoS Biol. 2011 Mar;9(3):e1001025. doi: 10.1371/journal.pbio.1001025. Epub 2011 Mar 8. PLoS Biol. 2011. PMID: 21408196 Free PMC article.
-
Functional interactions among STIM1, Orai1 and TRPC1 on the activation of SOCs in HL-7702 cells.Amino Acids. 2010 Jun;39(1):195-204. doi: 10.1007/s00726-009-0398-5. Epub 2009 Dec 9. Amino Acids. 2010. PMID: 19997763
-
Dynamic assembly of TRPC1-STIM1-Orai1 ternary complex is involved in store-operated calcium influx. Evidence for similarities in store-operated and calcium release-activated calcium channel components.J Biol Chem. 2007 Mar 23;282(12):9105-16. doi: 10.1074/jbc.M608942200. Epub 2007 Jan 15. J Biol Chem. 2007. PMID: 17224452 Free PMC article.
-
Contribution of TRPC1 and Orai1 to Ca(2+) entry activated by store depletion.Adv Exp Med Biol. 2011;704:435-49. doi: 10.1007/978-94-007-0265-3_24. Adv Exp Med Biol. 2011. PMID: 21290310 Free PMC article. Review.
-
Contribution and regulation of TRPC channels in store-operated Ca2+ entry.Curr Top Membr. 2013;71:149-79. doi: 10.1016/B978-0-12-407870-3.00007-X. Curr Top Membr. 2013. PMID: 23890115 Free PMC article. Review.
Cited by
-
Orai1, a critical component of store-operated Ca2+ entry, is functionally associated with Na+/Ca2+ exchanger and plasma membrane Ca2+ pump in proliferating human arterial myocytes.Am J Physiol Cell Physiol. 2009 Nov;297(5):C1103-12. doi: 10.1152/ajpcell.00283.2009. Epub 2009 Aug 12. Am J Physiol Cell Physiol. 2009. PMID: 19675303 Free PMC article.
-
Loss of TRPC1-mediated Ca2+ influx contributes to impaired degranulation in Fyn-deficient mouse bone marrow-derived mast cells.J Leukoc Biol. 2010 Nov;88(5):863-75. doi: 10.1189/jlb.0510253. Epub 2010 Jun 22. J Leukoc Biol. 2010. PMID: 20571036 Free PMC article.
-
Exercise training decreases store-operated Ca2+entry associated with metabolic syndrome and coronary atherosclerosis.Cardiovasc Res. 2010 Feb 1;85(3):631-40. doi: 10.1093/cvr/cvp308. Epub 2009 Sep 10. Cardiovasc Res. 2010. PMID: 19744946 Free PMC article.
-
Interactions between calcium regulatory pathways and mechanosensitive channels in airways.Expert Rev Respir Med. 2023 Jul-Dec;17(10):903-917. doi: 10.1080/17476348.2023.2276732. Epub 2023 Nov 24. Expert Rev Respir Med. 2023. PMID: 37905552 Free PMC article. Review.
-
Redox regulation of endothelial canonical transient receptor potential channels.Antioxid Redox Signal. 2011 Sep 15;15(6):1567-82. doi: 10.1089/ars.2010.3740. Epub 2011 May 25. Antioxid Redox Signal. 2011. PMID: 21126201 Free PMC article. Review.
References
-
- Putney, J. W., Jr. (1986) Cell Calcium 7 1–12 - PubMed
-
- Beech, D. J. (2005) Pfluegers Arch. Eur. J. Physiol. 451 53–60 - PubMed
-
- Liu, X., Groschner, K., and Ambudkar, I. S. (2004) J. Membr. Biol. 200 93–104 - PubMed
-
- Parekh, A. B., and Putney, J. W., Jr. (2005) Physiol. Rev. 85 757–810 - PubMed
-
- Lewis, R. S. (2007) Nature 446 284–287 - PubMed
MeSH terms
Substances
LinkOut - more resources
Full Text Sources
Other Literature Sources
Molecular Biology Databases
Miscellaneous
