

Characterization of a functional (pro)renin receptor in rat brain neurons
- PMID: 18326551
- PMCID: PMC3130537
- DOI: 10.1113/expphysiol.2008.041988
Characterization of a functional (pro)renin receptor in rat brain neurons
Abstract
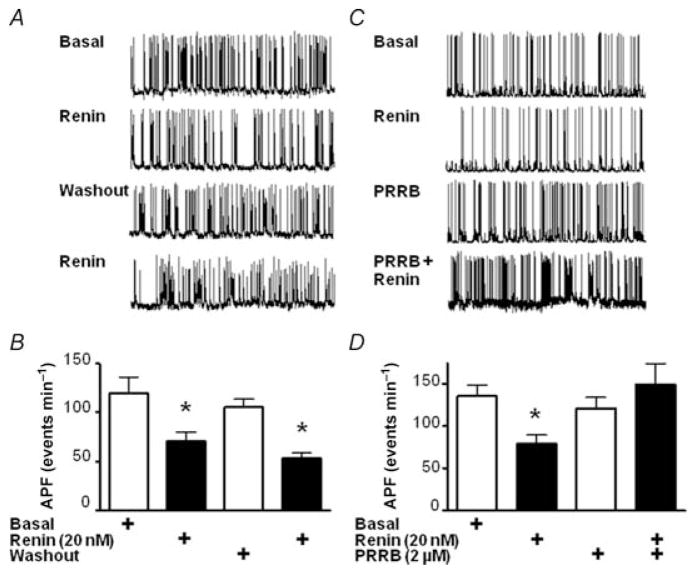
(Pro)renin receptor (PRR), the newest member of the renin-angiotensin system (RAS), is turning out to be an important player in the regulation of the cardiovascular system. It plays a pivotal role in activation of the local RAS and stimulates signalling pathways involved in proliferative and hypertrophic mechanisms. However, the role of PRR in the brain remains unknown. Thus, our objective in this study was to determine whether a functional PRR is present in neurons within the brain. Neuronal co-cultures from the hypothalamus and brainstem areas of neonatal rat brain express PRR mRNA. Immunoreactivity for PRR was primarily localized on the neuronal cell soma and in discrete areas in the neurites. Treatment of neurons with renin, in the presence of 2 microm losartan, caused a time- and dose-dependent stimulation of phosphorylation of extracellular signal related kinase ERK1 (p44) and ERK2 (p42) isoforms of mitogen-activated protein kinase. Optimal stimulation of fourfold was observed within 2 min with 20 nm renin. Electrophysiological recordings showed that treatment of the neurons with renin, in the presence of 2 microm losartan, resulted in a steady and stable decrease in action potential frequency. A 46% decrease in action potential frequency was observed within 5 min of treatment and was attenuated by co-incubation with a PRR blocking peptide. These observations demonstrate that the PRR is present in neurons within the brain and that its activation by renin initiates the MAP kinase signalling pathway and inhibition of neuronal activity.
Figures


Similar articles
-
Involvement of the brain (pro)renin receptor in cardiovascular homeostasis.Circ Res. 2010 Oct 1;107(7):934-8. doi: 10.1161/CIRCRESAHA.110.226977. Epub 2010 Aug 5. Circ Res. 2010. PMID: 20689062 Free PMC article.
-
(Pro)renin receptor mediates both angiotensin II-dependent and -independent oxidative stress in neuronal cells.PLoS One. 2013;8(3):e58339. doi: 10.1371/journal.pone.0058339. Epub 2013 Mar 14. PLoS One. 2013. PMID: 23516464 Free PMC article.
-
Glucose promotes the production of interleukine-1beta and cyclooxygenase-2 in mesangial cells via enhanced (Pro)renin receptor expression.Endocrinology. 2009 Dec;150(12):5557-65. doi: 10.1210/en.2009-0442. Epub 2009 Oct 27. Endocrinology. 2009. PMID: 19861503 Free PMC article.
-
A current view of brain renin-angiotensin system: Is the (pro)renin receptor the missing link?Pharmacol Ther. 2010 Jan;125(1):27-38. doi: 10.1016/j.pharmthera.2009.07.007. Epub 2009 Aug 31. Pharmacol Ther. 2010. PMID: 19723538 Free PMC article. Review.
-
The critical role of the central nervous system (pro)renin receptor in regulating systemic blood pressure.Pharmacol Ther. 2016 Aug;164:126-34. doi: 10.1016/j.pharmthera.2016.04.006. Epub 2016 Apr 23. Pharmacol Ther. 2016. PMID: 27113409 Free PMC article. Review.
Cited by
-
Activation of the (pro)renin receptor in the paraventricular nucleus increases sympathetic outflow in anesthetized rats.Am J Physiol Heart Circ Physiol. 2015 Sep;309(5):H880-7. doi: 10.1152/ajpheart.00095.2015. Epub 2015 Jun 26. Am J Physiol Heart Circ Physiol. 2015. PMID: 26116710 Free PMC article.
-
Inhibitory Potential of Shen-Shuai-Ling Formulation on Renal Interstitial Fibrosis via Upregulation of PLZF.Evid Based Complement Alternat Med. 2022 Mar 31;2022:5967804. doi: 10.1155/2022/5967804. eCollection 2022. Evid Based Complement Alternat Med. 2022. PMID: 35399631 Free PMC article.
-
Involvement of the brain (pro)renin receptor in cardiovascular homeostasis.Circ Res. 2010 Oct 1;107(7):934-8. doi: 10.1161/CIRCRESAHA.110.226977. Epub 2010 Aug 5. Circ Res. 2010. PMID: 20689062 Free PMC article.
-
Intracerebroventricular infusion of the (Pro)renin receptor antagonist PRO20 attenuates deoxycorticosterone acetate-salt-induced hypertension.Hypertension. 2015 Feb;65(2):352-61. doi: 10.1161/HYPERTENSIONAHA.114.04458. Epub 2014 Nov 24. Hypertension. 2015. PMID: 25421983 Free PMC article.
-
Activation of Orexin System Stimulates CaMKII Expression.Front Physiol. 2021 Jul 1;12:698185. doi: 10.3389/fphys.2021.698185. eCollection 2021. Front Physiol. 2021. PMID: 34276418 Free PMC article.
References
-
- Bader M, Peters J, Baltatu O, Muller DN, Luft FC, Ganten D. Tissue renin-angiotensin systems: new insights from experimental animal models in hypertension research. J Mol Med. 2001;79:76–102. - PubMed
-
- Baltatu O, Lippoldt A, Hansson A, Ganten D, Bader M. Local renin-angiotensin system in the pineal gland. Brain Res Mol Brain Res. 1998;54:237–242. - PubMed
-
- Burcklé CA, Jan Danser AH, Müller DN, Garrelds IM, Gasc JM, Popova E, Plehm R, Peters J, Bader M, Nguyen G. Elevated blood pressure and heart rate in human renin receptor transgenic rats. Hypertension. 2006;47:552–556. - PubMed
-
- Danser A, Batenburg W, van Esch J. Prorenin and the (pro)renin receptor—an update. Nephrol Dial Transplant. 2007;22:1288–1292. - PubMed
-
- de Gasparo M, Catt KJ, Inagami T, Wright JW, Unger T. International union of pharmacology. XXIII. The angiotensin II receptors. Pharmacol Rev. 2000;52:415–472. - PubMed
MeSH terms
Substances
Grants and funding
LinkOut - more resources
Full Text Sources
Other Literature Sources
Molecular Biology Databases
Miscellaneous