

Increased shear stress with upregulation of VEGF-A and its receptors and MMP-2, MMP-9, and TIMP-1 in venous stenosis of hemodialysis grafts
- PMID: 18326810
- PMCID: PMC3992704
- DOI: 10.1152/ajpheart.00650.2007
Increased shear stress with upregulation of VEGF-A and its receptors and MMP-2, MMP-9, and TIMP-1 in venous stenosis of hemodialysis grafts
Abstract
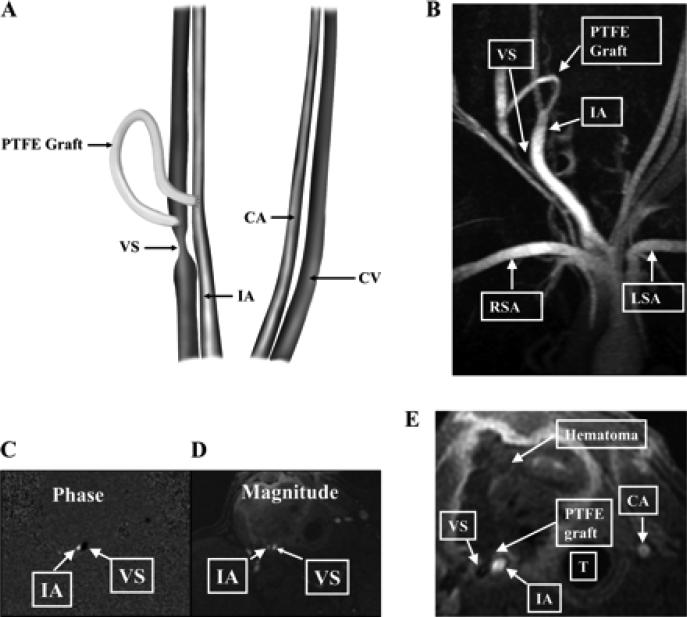
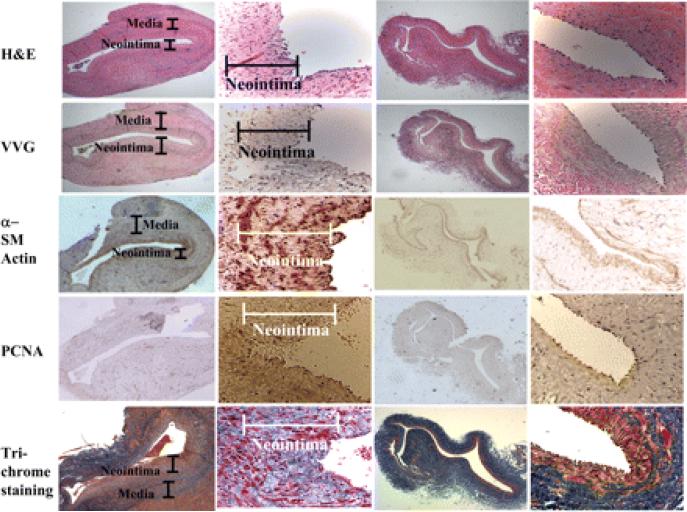
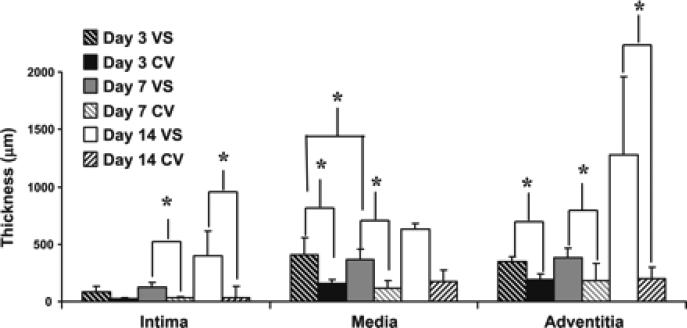
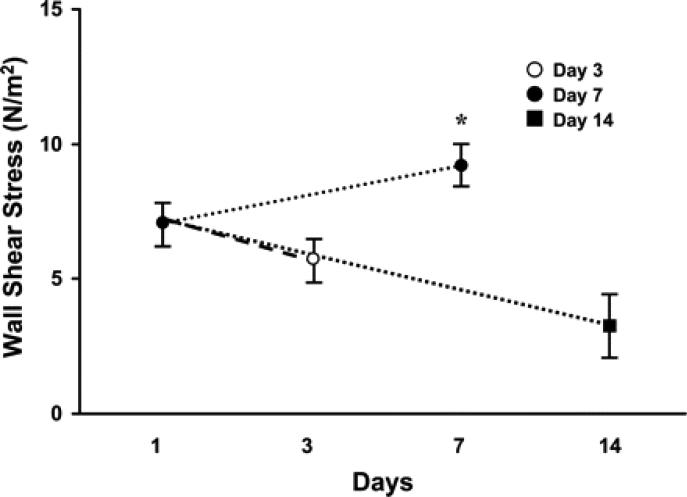
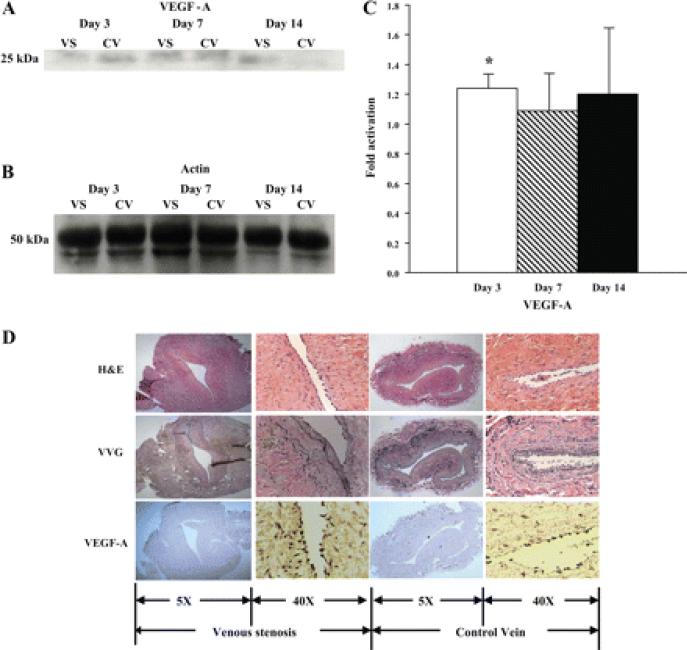
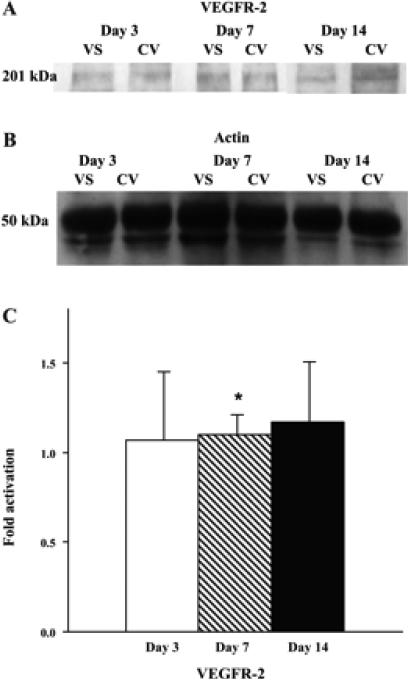
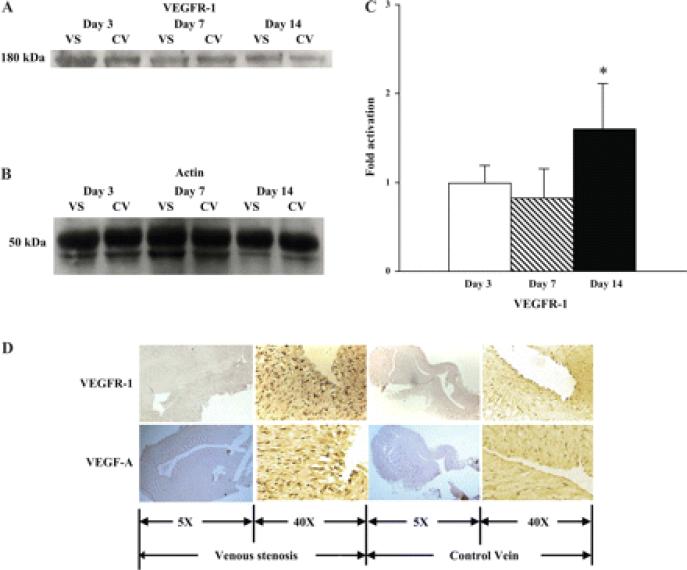
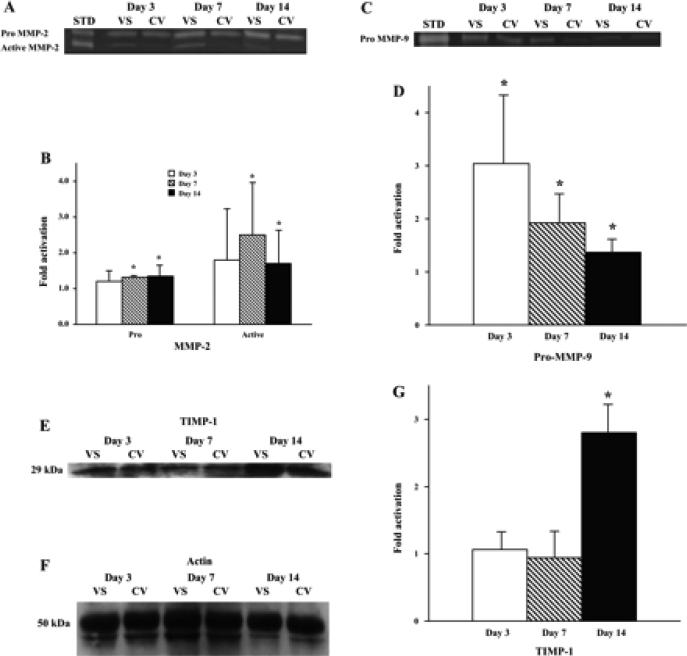
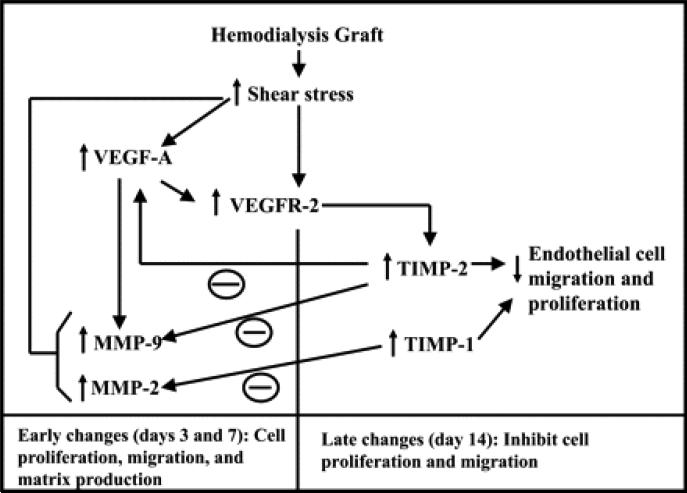
Venous injury and subsequent venous stenosis formation are responsible for hemodialysis graft failure. Our hypothesis is that these pathological changes are in part related to changes in wall shear stress (WSS) that results in the activation of matrix regulatory proteins causing subsequent venous stenosis formation. In the present study, we examined the serial changes in WSS, blood flow, and luminal vessel area that occur subsequent to the placement of a hemodialysis graft in a porcine model of chronic renal insufficiency. We then determined the corresponding histological, morphometric, and kinetic changes of several matrix regulatory proteins including VEGF-A, its receptors, matrix metalloproteinase (MMP)-2, MMP-9, tissue inhibitor of matrix metalloproteinase (TIMP)-1, and TIMP-2. WSS was estimated by obtaining blood flow and luminal vessel area by performing phase-contrast MRI with magnetic resonance angiography in 21 animals at 1 day after graft placement and prior to death on day 3 (n = 7), day 7 (n = 7), and day 14 (n = 7). At all time points, the mean WSS at the vein-to-graft anastomosis was significantly higher than that at the control vein (P < 0.05). WSS had a bimodal distribution with peaks on days 1 and 7 followed by a significant reduction in WSS by day 14 (P < 0.05 compared with day 7) and a decrease in luminal vessel area compared with control vessels. By day 3, there was a significant increase in VEGF-A and pro-MMP-9 followed by, on day 7, increased pro-MMP-2, active MMP-2, and VEGF receptor (VEGFR)-2 (P < 0.05) and, by day 14, increased VEGFR-1 and TIMP-1 (P < 0.05) at the vein-to-graft anastomosis compared with control vessels. Over time, the neointima thickened and was composed primarily of alpha-smooth muscle actin-positive cells with increased cellular proliferation. Our data suggest that hemodialysis graft placement leads to early increases in WSS, VEGF-A, and pro-MMP-9 followed by subsequent increases in pro-MMP-2, active MMP-2, VEGFR-1, VEGFR-2, and TIMP-1, which may contribute to the development of venous stenosis.
Figures
Similar articles
-
Increased expression of HIF-1alpha, VEGF-A and its receptors, MMP-2, TIMP-1, and ADAMTS-1 at the venous stenosis of arteriovenous fistula in a mouse model with renal insufficiency.J Vasc Interv Radiol. 2010 Aug;21(8):1255-61. doi: 10.1016/j.jvir.2010.02.043. Epub 2010 Jul 3. J Vasc Interv Radiol. 2010. PMID: 20598569 Free PMC article.
-
Wall shear stress measurement using phase contrast magnetic resonance imaging with phase contrast magnetic resonance angiography in arteriovenous polytetrafluoroethylene grafts.Angiology. 2009 Aug-Sep;60(4):441-7. doi: 10.1177/0003319709335908. Epub 2009 Jul 21. Angiology. 2009. PMID: 19625275 Free PMC article.
-
Adventitial transduction of lentivirus-shRNA-VEGF-A in arteriovenous fistula reduces venous stenosis formation.Kidney Int. 2014 Feb;85(2):289-306. doi: 10.1038/ki.2013.290. Epub 2013 Aug 7. Kidney Int. 2014. PMID: 23924957 Free PMC article.
-
Intimal hyperplasia and hemodynamic factors in arterial bypass and arteriovenous grafts: a review.J Artif Organs. 2003;6(4):227-35. doi: 10.1007/s10047-003-0232-x. J Artif Organs. 2003. PMID: 14691664 Review.
-
Novel paradigms for dialysis vascular access: upstream hemodynamics and vascular remodeling in dialysis access stenosis.Clin J Am Soc Nephrol. 2013 Dec;8(12):2186-93. doi: 10.2215/CJN.03450413. Epub 2013 Aug 29. Clin J Am Soc Nephrol. 2013. PMID: 23990161 Free PMC article. Review.
Cited by
-
Neutrophil gelatinase-associated lipocalin (NGAL) and matrix metalloproteinases as novel stress markers in children and young adults on chronic dialysis.Cell Stress Chaperones. 2011 Mar;16(2):163-71. doi: 10.1007/s12192-010-0228-4. Epub 2010 Sep 19. Cell Stress Chaperones. 2011. PMID: 20853162 Free PMC article.
-
The Role of Repeat Administration of Adventitial Delivery of Lentivirus-shRNA-Vegf-A in Arteriovenous Fistula to Prevent Venous Stenosis Formation.J Vasc Interv Radiol. 2016 Apr;27(4):576-83. doi: 10.1016/j.jvir.2015.12.751. Epub 2016 Mar 2. J Vasc Interv Radiol. 2016. PMID: 26948326 Free PMC article.
-
Expression of profibrotic genes in a murine remnant kidney model.J Vasc Interv Radiol. 2011 Dec;22(12):1765-72.e1. doi: 10.1016/j.jvir.2011.08.026. Epub 2011 Oct 26. J Vasc Interv Radiol. 2011. PMID: 22030458 Free PMC article.
-
Effects of wall distensibility in hemodynamic simulations of an arteriovenous fistula.Biomech Model Mechanobiol. 2014 Jun;13(3):679-95. doi: 10.1007/s10237-013-0527-7. Epub 2013 Sep 15. Biomech Model Mechanobiol. 2014. PMID: 24037281 Free PMC article.
-
Advances and new frontiers in the pathophysiology of venous neointimal hyperplasia and dialysis access stenosis.Adv Chronic Kidney Dis. 2009 Sep;16(5):329-38. doi: 10.1053/j.ackd.2009.06.009. Adv Chronic Kidney Dis. 2009. PMID: 19695501 Free PMC article. Review.
References
-
- Arterburn LM, Hall EB, Oken H. Distribution, interconversion, and dose response of n-3 fatty acids in humans. Am J Clin Nutr. 2006;83:1467S–1476S. MedlineWeb of Science. - PubMed
-
- Bang HO, Dyerberg J, Sinclair HM. The composition of the Eskimo food in north western Greenland. Am J Clin Nutr. 1980;33:2657–2661. Abstract/FREE Full Text. - PubMed
-
- Billman GE, Kang JX, Leaf A. Prevention of sudden cardiac death by dietary pure omega-3 polyunsaturated fatty acids in dogs. Circulation. 1999;99:2452–2457. Abstract/FREE Full Text. - PubMed
-
- Bordoni A, Angeloni C, Leoncini E, Danesi F, Maranesi M, Biagi PL, Hrelia S. Hypoxia/reoxygenation alters essential fatty acids metabolism in cultured rat cardiomyocytes: protection by antioxidants. Nutr Metab Cardiovasc Dis. 2005;15:166–173. CrossRefMedlineWeb of Science. - PubMed
Publication types
MeSH terms
Substances
Grants and funding
LinkOut - more resources
Full Text Sources
Medical
Molecular Biology Databases
Research Materials
Miscellaneous