

Development and dynamics of robust T-cell responses to CML under imatinib treatment
- PMID: 18326818
- PMCID: PMC2396727
- DOI: 10.1182/blood-2007-12-128397
Development and dynamics of robust T-cell responses to CML under imatinib treatment
Abstract
Novel molecular targeted therapies, such as imatinib for chronic myelogenous leukemia (CML), represent the first agents that inhibit cancer cells more than other dividing cells, such as immune cells. We hypothesize that imatinib may create a window in which the immune response is partially restored while apoptotic leukemic cells are present, thus rendering leukemic cells immunogenic as patients enter remission. To detect and quantify antileukemia immune responses in an antigen-unbiased way, we used cryopreserved autologous pretreatment blood samples (representing predominantly leukemic cells) as stimulators to detect antileukemia T-cell responses in CML patients in remission on imatinib. We studied patients over time to address the dynamics of such responses. Our data show that antileukemia T-cell responses develop in the majority of CML patients (9 of 14) in remission and that CD4(+) T cells producing tumor necrosis factor-alpha (median 17.6%) represent the major response over interferon-gamma. This confirms the immune system's ability to respond to leukemia under certain conditions. Such responses may be further amplified as a potential therapy that synergizes with imatinib for improved control of CML.
Figures
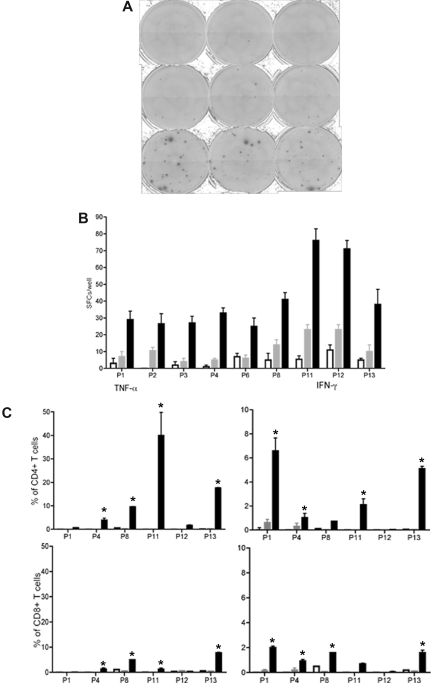
 ). The following stimulated remission samples from the patients are shown and depicted as median and range: P1, 5 months; P2, 12 months; P3, 6 months; P4, 18 months; P6, 14 months; P8, 15 months; P11, 4 months; P12, 5 months; P13, 12 months. All responses were statistically significant (P < .05) compared with leukemic or remission samples alone. (C) TNF-α and IFN-γ production (CFC) by CD4+ T and CD8+ T cells in stimulated remission samples (■) from 6 patients. Leukemic cells alone (□) and remission samples alone (). The same remission samples shown in panel B were analyzed (*P < .05, statistically significant responses over background).
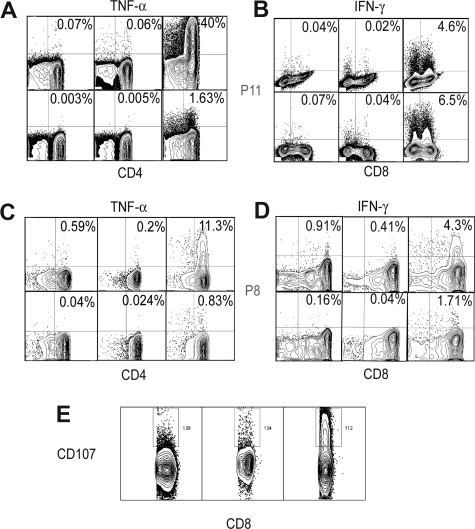
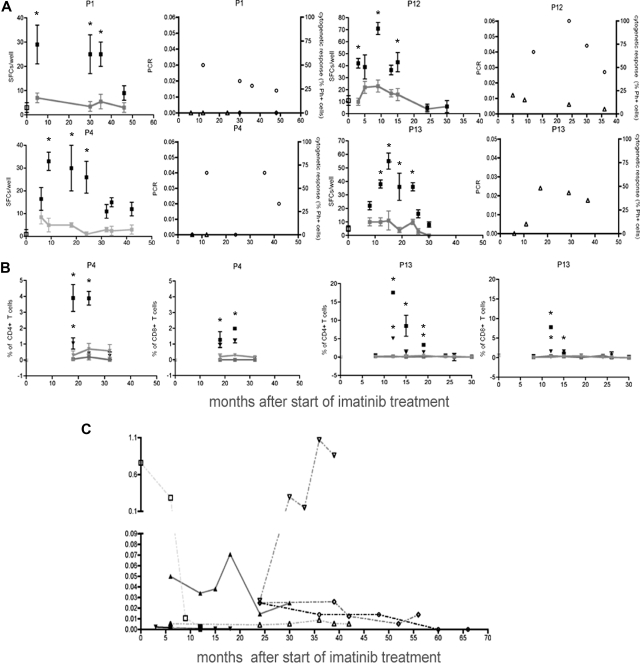 ). Background levels are connected by lines (*P < .05, statistically significant responses over background). Ratio of the tumor load measured by molecular responses (bcr-abl transcript/bcr-abl control gene, left panel, ○) and levels of Ph+ cells in chromosome analysis (right panel, ▵) at the corresponding time points. (B) TNF-α (■) and IFN-γ(▾) responses by CD4+ and CD8+ T cells (CFC) from patients P4 and P13 over time. Leukemic cells alone (TNF-α (■), IFN-γ(▾)) and remission samples alone (TNF-α (
 ), IFN-γ(
 ). Background levels are connected by lines (*P < .05, statistically significant responses over background). (C) Tumor load over time from patients P5(▴), P6(▾), P7 (♦), P8 (●), connected by solid lines, and patients P9 (□), P11 (▿), and P14 (○), connected by dotted lines. Error bars indicate ranges of triplicate measurements. Results are representative of 2 or 3 independent experiments.
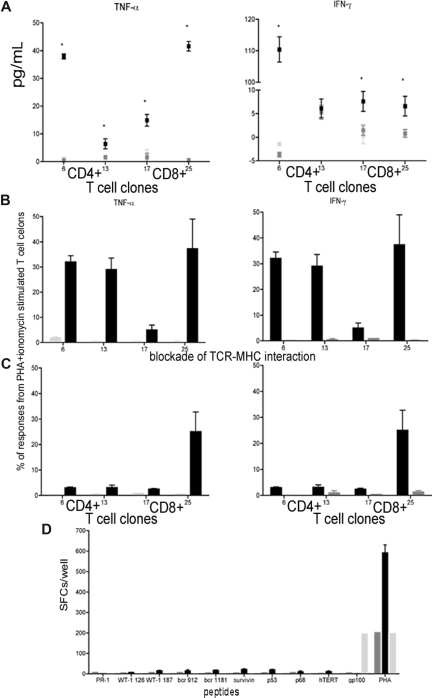 ) and T-cell clones stimulated with remission sample (). (B,C) Responses in T-cell clones stimulated with remission sample pulsed with lysate from autologous leukemic cells (■) and remission sample pulsed with lysate from the AML cell line THP1 (
 ) using CFC for TNF-α and IFN-γ (B) and blocked with anti-CD4 and anti-MHC II antibodies or anti-CD8 and anti-MHC II antibodies, respectively (C). Results were compared with PHA and ionomycin-stimulated T-cell clones. (D) T-cell responses in CD8+ T-cell clones pulsed with HLA-A0201 restricted peptides from LAAs and TAAs using ELISPOT assay compared with PHA stimulated CD8+ T-cell clones, and CD8+ T-cell clones stimulated with a peptide from the melanoma-associated antigen gp100. Results are shown as median and range.
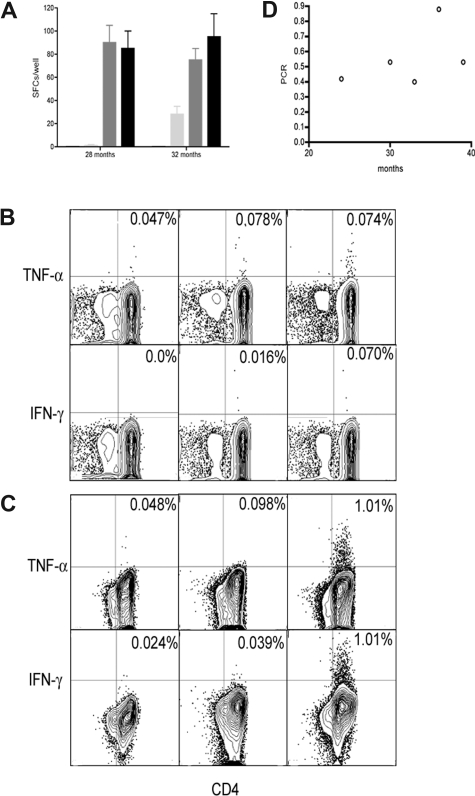 ), and leukemic cells alone (□). Results are shown as median and range. Immune responses in prestimulated remission samples using CFC: (B) 28 months; (C) 32 months. Remission samples from P10 stimulated with autologous leukemic cells (third column), unstimulated remission samples (second column), and leukemic cells alone (first columns). (D) Tumor load from patient P10 over time (○).
Similar articles
-
Strategic treatment interruptions during imatinib treatment of chronic myelogenous leukemia.Bull Math Biol. 2011 May;73(5):1082-100. doi: 10.1007/s11538-010-9553-0. Epub 2010 Jun 9. Bull Math Biol. 2011. PMID: 20532990 Free PMC article.
-
Dynamics and potential impact of the immune response to chronic myelogenous leukemia.PLoS Comput Biol. 2008 Jun 20;4(6):e1000095. doi: 10.1371/journal.pcbi.1000095. PLoS Comput Biol. 2008. PMID: 18566683 Free PMC article.
-
Serial monitoring of BCR-ABL transcripts in chronic myelogenous leukemia (CML) treated with imatinib mesylate.Med Oncol. 2004;21(4):349-58. doi: 10.1385/MO:21:4:349. Med Oncol. 2004. PMID: 15579919
-
Targeted chronic myeloid leukemia therapy: Seeking a cure.Am J Health Syst Pharm. 2007 Dec 15;64(24 Suppl 15):S9-15. doi: 10.2146/ajhp070482. Am J Health Syst Pharm. 2007. PMID: 18056932 Review.
-
Imatinib: a review of its use in chronic myeloid leukaemia.Drugs. 2007;67(2):299-320. doi: 10.2165/00003495-200767020-00010. Drugs. 2007. PMID: 17284091 Review.
Cited by
-
The secret ally: immunostimulation by anticancer drugs.Nat Rev Drug Discov. 2012 Feb 3;11(3):215-33. doi: 10.1038/nrd3626. Nat Rev Drug Discov. 2012. PMID: 22301798 Review.
-
Strategic treatment interruptions during imatinib treatment of chronic myelogenous leukemia.Bull Math Biol. 2011 May;73(5):1082-100. doi: 10.1007/s11538-010-9553-0. Epub 2010 Jun 9. Bull Math Biol. 2011. PMID: 20532990 Free PMC article.
-
Regular Humoral and Cellular Immune Responses in Individuals with Chronic Myeloid Leukemia Who Received a Full Vaccination Schedule against COVID-19.Cancers (Basel). 2023 Oct 20;15(20):5066. doi: 10.3390/cancers15205066. Cancers (Basel). 2023. PMID: 37894433 Free PMC article.
-
New experimental and theoretical investigations of hematopoietic stem cells and chronic myeloid leukemia.Blood Cells Mol Dis. 2009 Jul-Aug;43(1):88-97. doi: 10.1016/j.bcmd.2009.03.003. Epub 2009 May 2. Blood Cells Mol Dis. 2009. PMID: 19411181 Free PMC article.
-
Immune Effector Recovery in Chronic Myeloid Leukemia and Treatment-Free Remission.Front Immunol. 2017 Apr 24;8:469. doi: 10.3389/fimmu.2017.00469. eCollection 2017. Front Immunol. 2017. PMID: 28484463 Free PMC article. Review.
References
-
- Sawyers CL. Chronic myeloid leukemia. N Engl J Med. 1999;340:1330–1340. - PubMed
-
- Lee SJ. Chronic myelogenous leukaemia. Br J Haematol. 2000;111:993–1009. - PubMed
-
- Angstreich GR, Smith BD, Jones RJ. Treatment options for chronic myeloid leukemia: imatinib versus interferon versus allogeneic transplant. Curr Opin Oncol. 2004;16:95–99. - PubMed
-
- Cortes J, Talpaz M, O'Brien S, et al. Molecular responses in patients with chronic myelogenous leukemia in chronic phase treated with imatinib mesylate. Clin Cancer Res. 2005;11:3425–3432. - PubMed
Publication types
MeSH terms
Substances
Grants and funding
LinkOut - more resources
Full Text Sources
Other Literature Sources
Medical
Research Materials
