Comparative Study
. 2008 Apr;11(4):505-13.
doi: 10.1038/nn2070. Epub 2008 Mar 9.

Neural correlates of perceptual learning in a sensory-motor, but not a sensory, cortical area

Affiliations
Comparative Study

Neural correlates of perceptual learning in a sensory-motor, but not a sensory, cortical area

Chi-Tat Law et al. Nat Neurosci. 2008 Apr.

Abstract

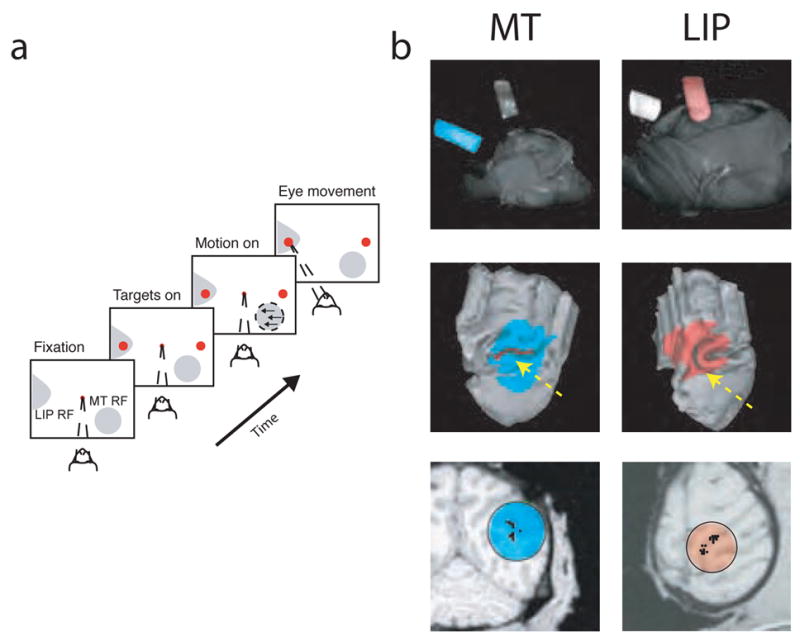
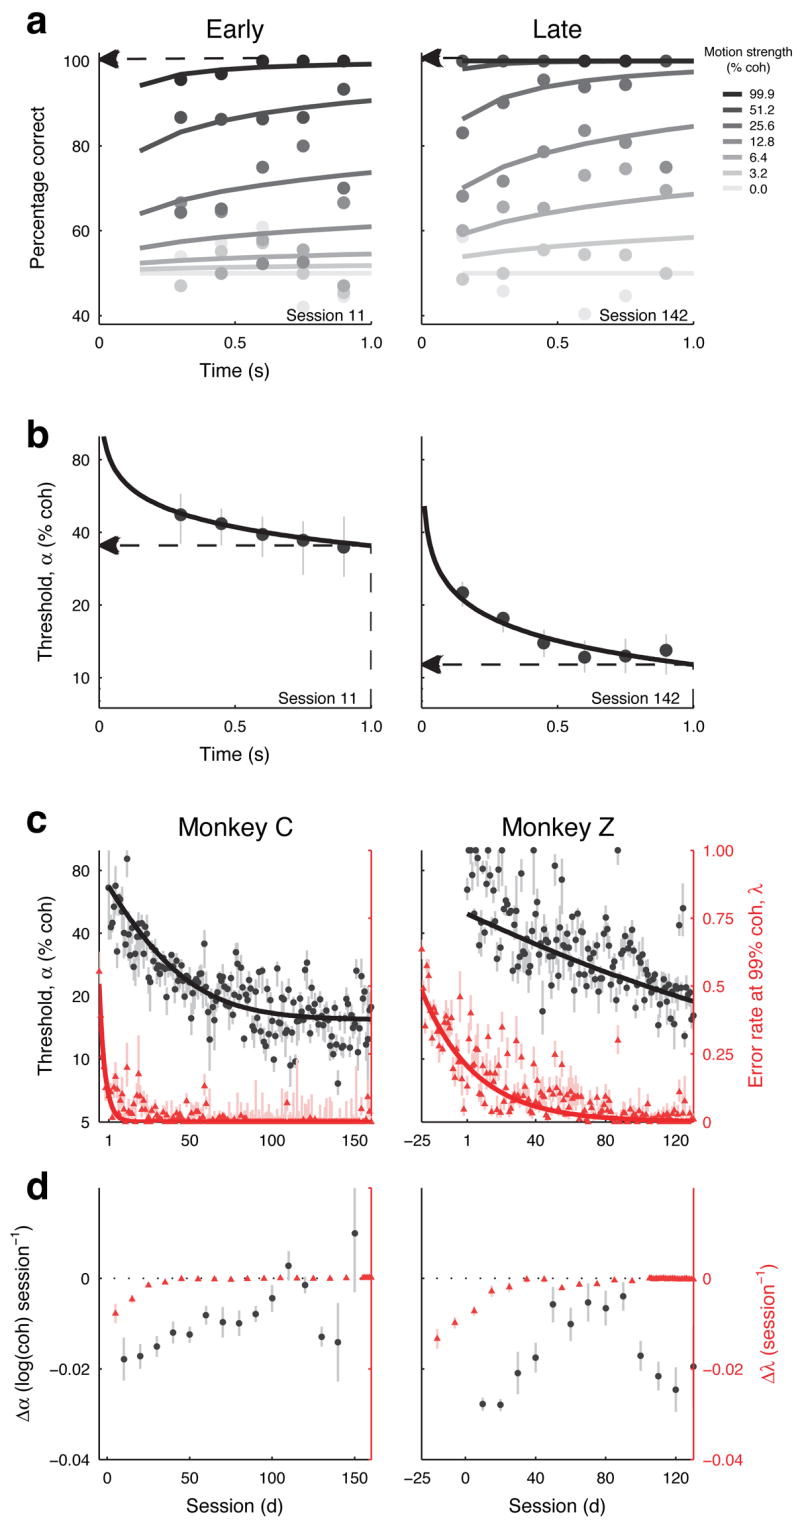
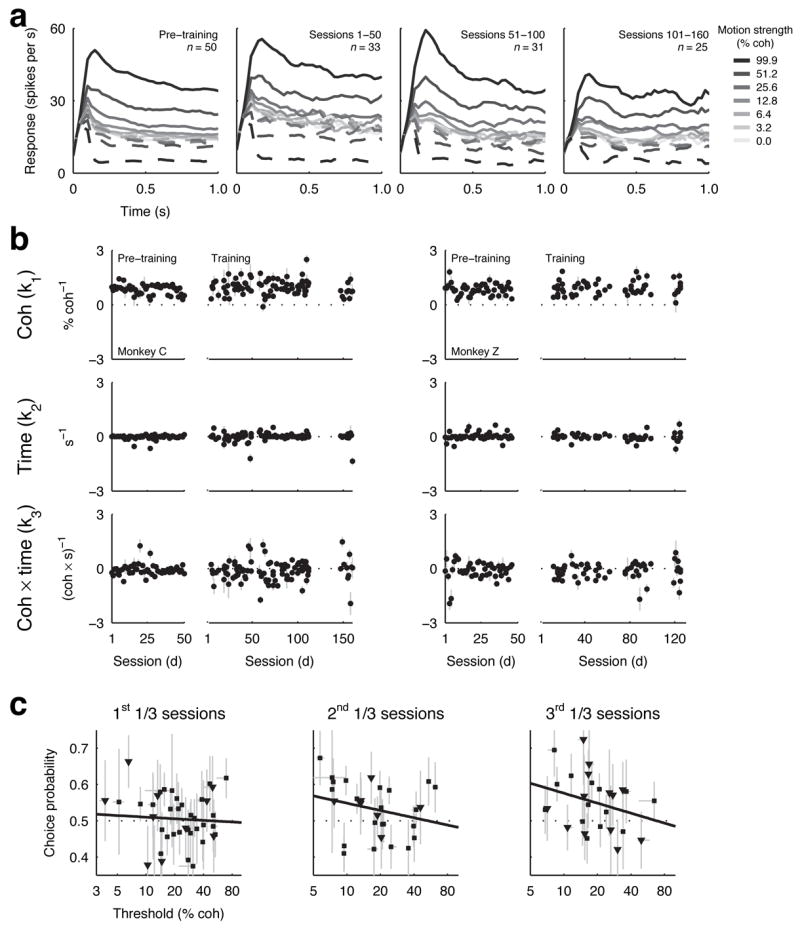
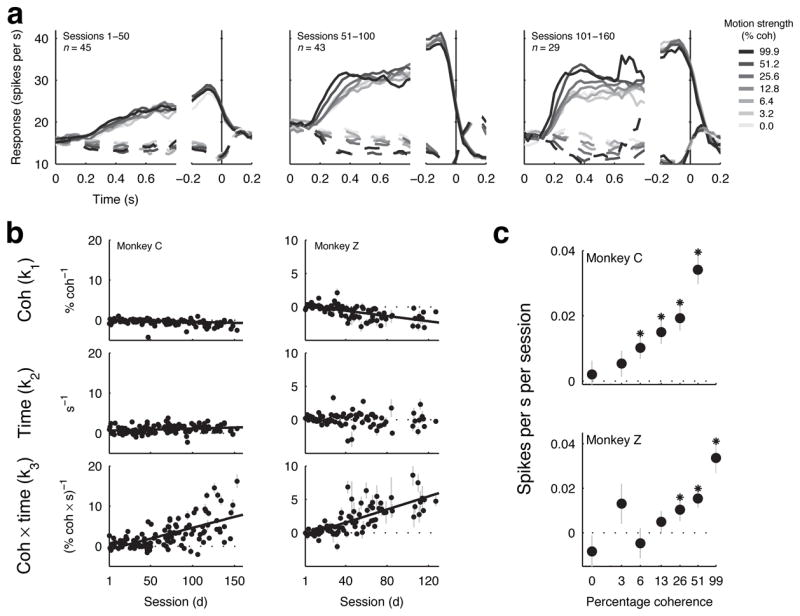
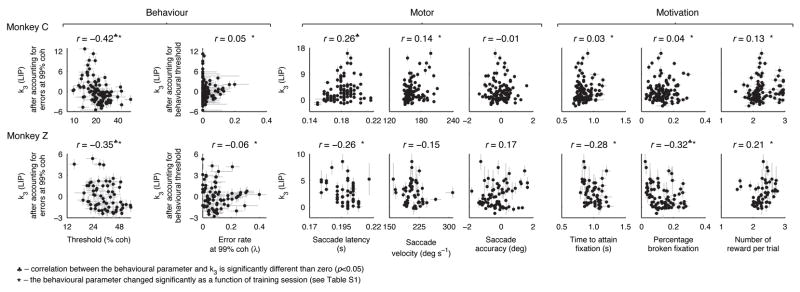
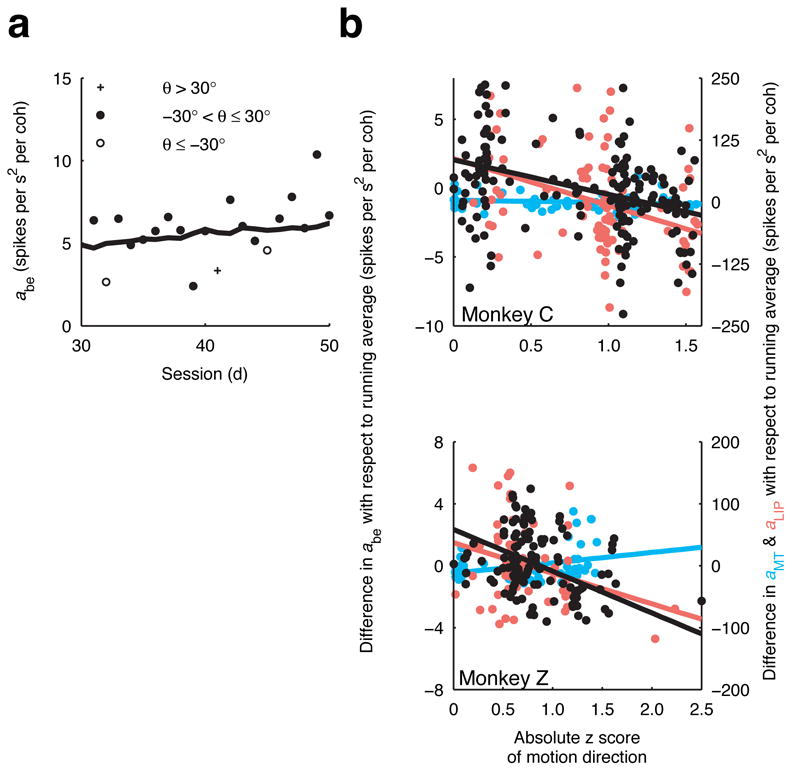
This study aimed to identify neural mechanisms that underlie perceptual learning in a visual-discrimination task. We trained two monkeys (Macaca mulatta) to determine the direction of visual motion while we recorded from their middle temporal area (MT), which in trained monkeys represents motion information that is used to solve the task, and lateral intraparietal area (LIP), which represents the transformation of motion information into a saccadic choice. During training, improved behavioral sensitivity to weak motion signals was accompanied by changes in motion-driven responses of neurons in LIP, but not in MT. The time course and magnitude of the changes in LIP correlated with the changes in behavioral sensitivity throughout training. Thus, for this task, perceptual learning does not appear to involve improvements in how sensory information is represented in the brain, but rather how the sensory representation is interpreted to form the decision that guides behavior.


Figures

Figure 1
Figure 1
Task and anatomical localization. a, Direction-discrimination task. The motion stimulus matched the RF location and preferred direction (and its 180° opposite) of the MT neuron being recorded or the modal values from previous sessions if no MT neuron was found. One target was placed in the response field of the LIP neuron being recorded or the modal location from previous sessions if no LIP neuron was found, the other in the opposite visual hemifield. b, Anatomical localization of recording site locations in areas MT (left, cyan) and LIP (right, red) using magnetic resonance imaging (MRI). Top: volume rendering using the AFNI render plugin showing the 3D orientation of the recording cylinders relative to the head. Middle: partial reconstruction of the cortical surface along with the projection of the recording cylinder using Caret and SureFit and custom software. The yellow arrow in the left panel points to the location of area MT (red), along the superior temporal sulcus. The yellow arrow in the right panel points to the location of area LIP (brown), along the intraparietal sulcus. Bottom: partial penetration maps of successful recording sites (black points) superimposed on planes of section perpendicular to the long axis of the recording cylinder. MT sites (top) ranged in depth from 6–9 mm from the dura mater. LIP sites (bottom) ranged in depth from 4–7 mm from the dura mater. These images were generated with methods described in R.M. Kalwani, L. Bloy, J. Hulvershorn, M.A. Elliot & J.I. Gold, Soc. Neurosci. Abstr. 454.14, 2005.
Figure 2
Figure 2
Behaviour. a,b. Behavioural performance (a) and discrimination threshold (b, best fits and 68% CIs) as a function of viewing time (0.3-s-wide bins in 0.15-s intervals) for different motion strengths (see legend) from two representative sessions early (left) and late (right) in training. Discrimination thresholds in b were computed for each time bin using a cumulative Weibull function. Solid lines in a and b are behavioural performance and thresholds computed from a time-dependent cumulative Weibull function (Eq. 1) fit to each data set (not binned by viewing duration), respectively. We report error rates at 99.9% coherence (dashed arrows in a, σ in c and d) and discrimination thresholds at 1-s viewing duration from the fits (dashed arrows in b, ● in c and d). c, d, Discrimination threshold (●; note the logarithmic scale on the left ordinate) and error rate at 99.9% coherence (σ; linear scale on the right ordinate) with 68% CIs plotted as a function of training session for the two monkeys. Prior to session 1, monkeys were trained mostly with 99.9% coherence motion. Solid lines are best-fitting single exponential functions. d, Learning rates (best fits and SEM) of discrimination thresholds (● ) and errors at 99.9% coherence (σ ) during training for the two monkeys. The learning rate was computed as the slope of a linear fit to the behavioural data (log discrimination thresholds or errors at 99.9% coherence) within a 41-session wide bin. A negative learning rate implies that the behavioural parameter improved during that particular epoch of training.
Figure 3
Figure 3
MT responses. a, Average activity of MT neurons as a function of viewing time (using 0.1-s-wide time bins with 0.025-s increments) for different motion strengths (see legend) for each neuron’s preferred (solid line) and null (dashed line) motion during different training periods for monkey C. “Pre-training” refers to responses to the motion stimulus measured while the monkey was rewarded for simply fixating a central spot, before being trained on the discrimination task. b, Coherence-, viewing time- and coherence × viewing time-dependence (Eq. 3) of individual MT neurons before and during training for monkeys C (left) and Z (right). Error bars are 68% CIs. c, Relationship between neurometric threshold and choice probability for individual MT neurons during different training periods for monkeys C (■) and Z (▼). Error bars are 68% CIs. Solid lines are linear fits.
Figure 4
Figure 4
LIP responses. a. Average activity of LIP neurons as a function of viewing time (using 0.1-s-wide time bins with 0.025-s increments) for different motion strengths (see legend) for saccades into (solid line) and out of (dashed line) each neuron’s response field during different training periods for monkey C. Only correct trials were included. b. Coherence-, viewing time- and coherence × viewing time- dependence (Eq. 3) of individual LIP neurons before and during training for monkeys C (left) and Z (right). Error bars are 68% CIs. Solid lines are significant linear fits (p<0.05 for H0: slope=0). c. Coherence-specific effects of training on the rate of rise of LIP activities during motion viewing for monkeys C (top) and Z (bottom). The rate of rise was estimated separately for each coherence using a piecewise-linear function (Eq. 6 with the coherence-dependence term, β1, set to zero). Points and error bars are the slope and 68% CIs of a linear regression relating this rate of rise to session number (* indicates p<0.05 for H0: slope=0).
Figure 5
Figure 5
Relationship between the coherence- and time- dependent LIP responses (k3, Eq. 3) and various behavioural, motor and motivational parameters. The r-values for the behavioural parameters (left two columns) are the partial correlations between each parameter and k3 with the effect of the other parameter on k3 removed. Other r-values are the correlation coefficients between that behavioural parameter and k3. ♣ indicates a significant correlation between the behavioural parameter and k3 (p<0.05). * indicates that the behavioural parameter changed significantly as a function of training session (linear regression, p<0.05; see Table S1). Error bars are 68% CIs.
Figure 6
Figure 6
Decision model. a. Schematic of the decision model and example fits to behavioural, MT and LIP data. The decision model assumes that MT represents the coherence-dependent sensory evidence, LIP accumulates over time this sensory evidence into a decision variable, and the monkey’s choice depends on the value of this decision variable. The model allows us to fit separately data from MT, LIP and behaviour but extract a common parameter: the coherence dependence of the sensory information represented in each stage of processing (a in Eq. 4). b. Coherence dependence (best fit values and 68% CIs) computed from behavioural (left axes, black symbols) and neural data (right axes, cyan symbols for MT data, red symbols for LIP data). Solid lines are linear fits (H0: slope=0, monkey C: behaviour p<10−10, MT p=0.1056, LIP p<10−13; monkey Z: behaviour p<10−10, MT p=0.6349, LIP p<10−13). c. Relationship between a computed from behavioural data and neural data. ♣ indicates a significant correlation (p<0.05). Error bars are 68% CIs.
Figure 7
Figure 7
Specificity of learning. a. The coherence dependence of the sensory information (a in Eq. 4) estimated from behavioural performance from sessions 30–50 for monkey Z. The solid line is a 21-session running average. b. The difference between the coherence dependence from a given session and its 21-session running average for behaviour (black), MT (cyan) and LIP (red) responses are plotted against the absolute z score of motion direction for monkeys C (top) and Z (bottom). For a given session, the z score is computed using the distribution of motion directions used prior to that session. Thus, less frequently used motion directions will have larger z scores. Solid lines are linear fits.

References

    1. Goldstone RL. Perceptual learning. Annu Rev Psychol. 1998;49:585–612. - PubMed
    1. Karni A, Sagi D. Where practice makes perfect in texture discrimination: evidence for primary visual cortex plasticity. Proc Natl Acad Sci U S A. 1991;88:4966–4970. - PMC - PubMed
    1. Mollon JD, Danilova MV. Three remarks on perceptual learning. Spat Vis. 1996;10:51–58. - PubMed
    1. Dosher BA, Lu ZL. Mechanisms of perceptual learning. Vision Res. 1999;39:3197–3221. - PubMed
    1. Recanzone GH, Schreiner CE, Merzenich MM. Plasticity in the frequency representation of primary auditory cortex following discrimination training in adult owl monkeys. J Neurosci. 1993;13:87–103. - PMC - PubMed

Publication types