. 2008 Mar;28(3):425-35.
doi: 10.1016/j.immuni.2008.02.001. Epub 2008 Mar 6.

Locally produced complement fragments C5a and C3a provide both costimulatory and survival signals to naive CD4+ T cells

Affiliations

Locally produced complement fragments C5a and C3a provide both costimulatory and survival signals to naive CD4+ T cells

Michael G Strainic et al. Immunity. 2008 Mar.

Abstract

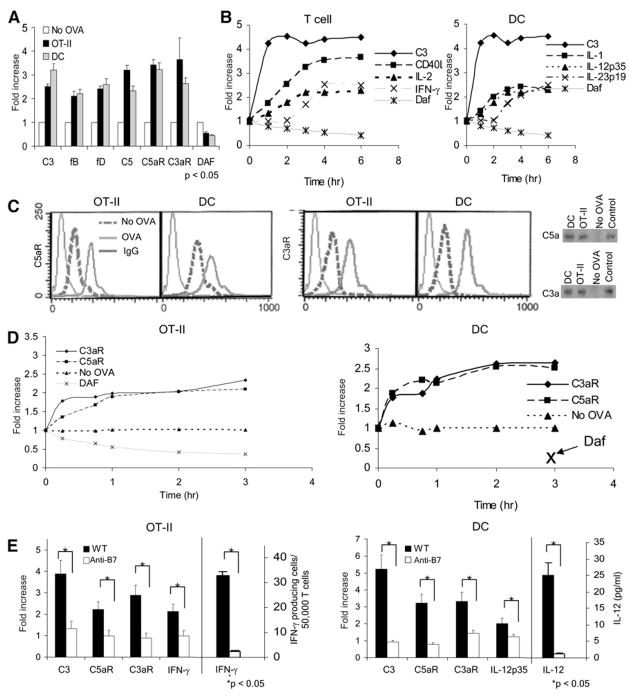
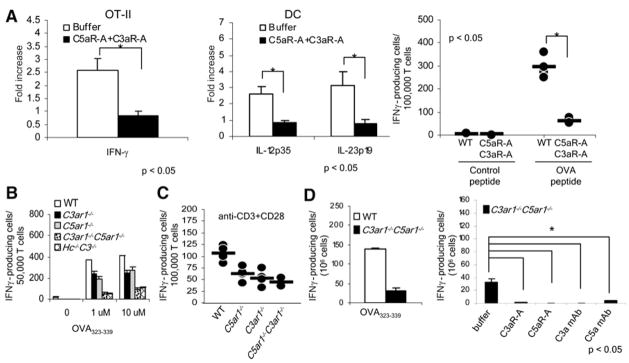
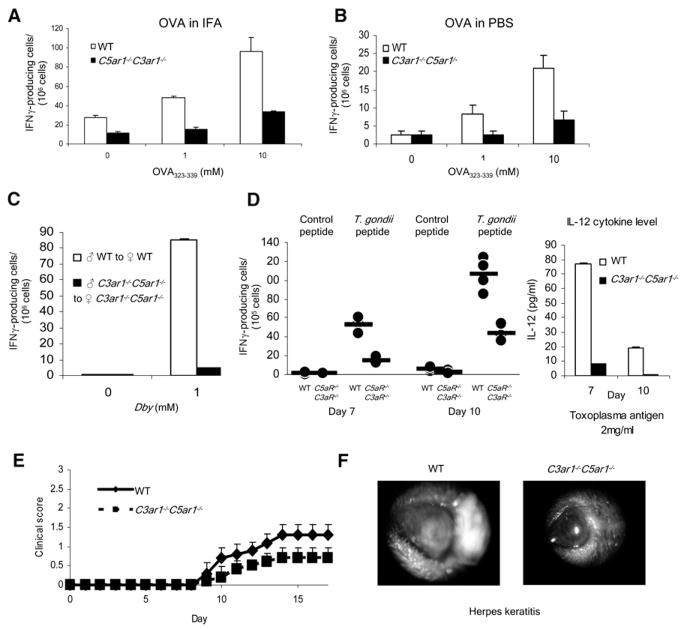
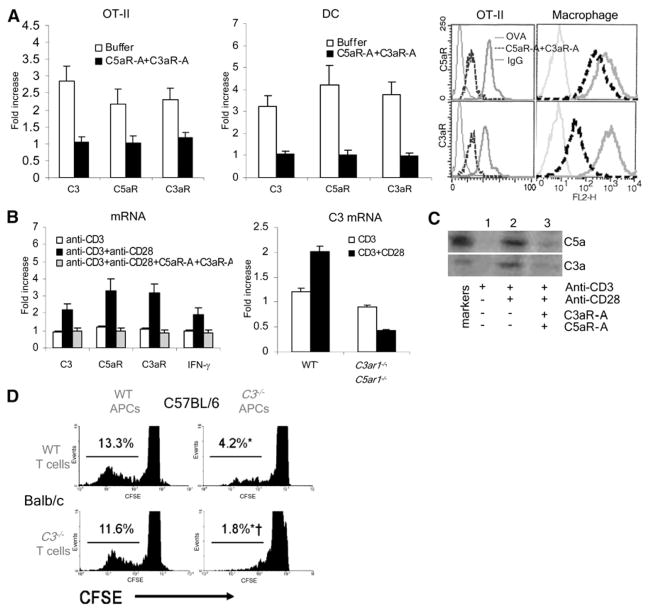
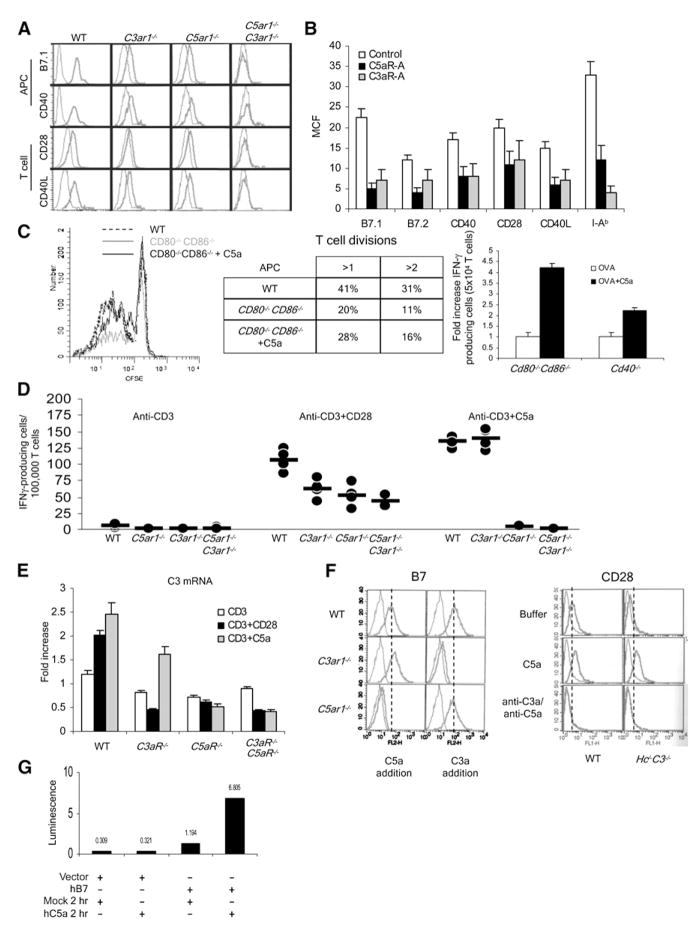
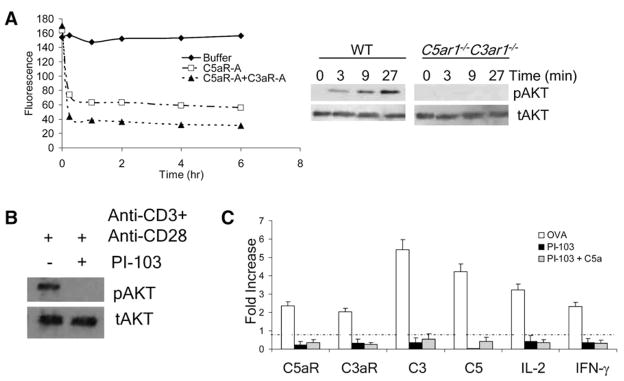
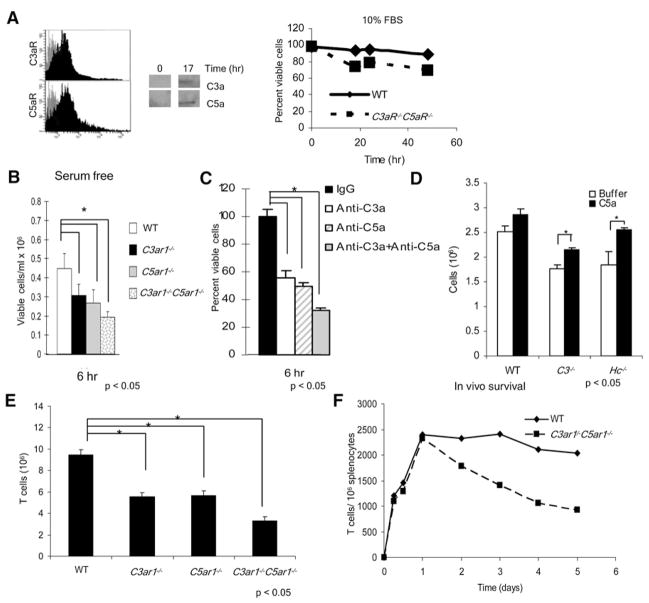
Costimulatory signals are critical to T cell activation, but how their effects are mediated remains incompletely characterized. Here, we demonstrate that locally produced C5a and C3a anaphylatoxins interacting with their G protein-coupled receptors (GPCRs), C5aR and C3aR, on APCs and T cells both upstream and downstream of CD28 and CD40L signaling are integrally involved in T cell proliferation and differentiation. Disabling these interactions reduced MHC class II and costimulatory-molecule expression and dramatically diminished T cell responses. Importantly, impaired T cell activation by Cd80-/-Cd86-/- and Cd40-/- APCs was reconstituted by added C5a or C3a. C5aR and C3aR mediated their effects via PI-3 kinase-gamma-dependent AKT phosphorylation, providing a link between GPCR signaling, CD28 costimulation, and T cell survival. These local paracrine and autocrine interactions thus operate constitutively in naive T cells to maintain viability, and their amplification by cognate APC partners thus is critical to T cell costimulation.


Figures

Figure 1
Figure 1. APC-T Cell Partners Upregulate Complement mRNAs and the RNAs Produce Proteins
(A) OT-II T cells were incubated for 1 hr with WT DCs ± 0.1 μM OVA323–339 and flow separated (with anti-CD3 and anti-CD11c,) and complement mRNA expression in each partner was measured by qPCR. (B) OT-II cells and DCs were flow separated at increasing times, and complement IL-2, IFN-γ, IL-12, and IL-23 gene expression was measured by qPCR. (C) The left side shows representative (rep) histograms (four exps; linear scales) depicting C5aR or C3aR on OT-II cells and DCs before (no OVA) and after 1 hr interaction with OVA. The right side shows that after 24 hr of interaction of DCs with OT-II cells ± OVA, flow-separated cells were cultured for 4 hr, and supernatants were blotted for C3a and C5a; stds = 2 ng. (D) Kinetics of C5aR, C3aR, and DAF protein expression on OT-II T cells and DCs during interaction with ova. Fold increase is relative to no OVA cultures. DAF levels on the DCs were low at all time points. (E) After interaction of OT-II cells with DCs ± ova for 18 hr with 4 μg/ml anti-B7.1 and anti-B7.2 mAbs or control IgG, mRNAs in flow-separated cells were assayed for C3, C3aR, C5aR, and IFNγ gene expression by qPCR. In parallel cultures, IFNγ was assessed by ELISPOT. No complement or cytokine upregulation occurred without T cells. Data are normalized to no OVA. Each experiment is representative of two to four replicate studies. *p < 0.05 versus controls. All error bars are ± SD.
Figure 2
Figure 2. Disabling C3aR and C5aR Prevents T Cell Immunity In Vitro
(A) OT-II T cells were incubated for 48 hr with WT DCs and OVA323–339 ± 10 ng/ml C5aR-A and 10 ng/ml C3aR-A and either flow separated and assayed for mRNA expression by qPCR (left and middle) or assayed for IFNγ+ cells by ELISPOT (right; dots represent overlapping replicates, n = 5 per group). (B) OT-II T cells were incubated for 48 hr at 37°C with WT, C3ar1−/−, C5ar1−/−, C5ar1−/−C3ar1−/−, or C3−/−Hc−/− DCs + OVA323–339 and assayed for IFNγ+ cells by ELISPOT. (C) Purified WT, C3ar1−/−, C5ar1−/−, or C5ar1−/− C3ar1−/− T cells (>96% CD3+) were stimulated with 1 μg/ml anti-CD3 + 1 μg/ml anti-CD28 for 3 hr and assayed for IFNγ+ cells (n = 5 each group; some dots overlap. (D) OT-II T cells were incubated for 48 hr at 37°C with WT or C3ar1−/−C5ar1−/− DCs in the presence of 10 ng/ml C5aR-A and C3aR-A or 10 μg/ml anti-C5a+C3a mAbs, after which IFN-γ producing cells were assayed by ELISPOT. Each experiment was repeated at least twice with comparable results. *p < 0.05. All error bars are ± SD.
Figure 3
Figure 3. The Absence of C3aR and C5aR Prevents T Cell Immunity In Vivo
(A) WT or C5ar1−/−C3ar1−/− mice (n = 3 per group) were immunized with ovalbumin protein mixed in IFA, and spleen cells on day 10 were assayed for responses to OVA323–339 by ELISPOT. No response occurred with control peptides or naive mice. (B) Analogous to the experiment in (A), animals were injected s.c. with ovalbumin mixed in PBS, and responses to OVA323–339 were assayed on day 10. (C) Syngeneic WT and C5ar1−/−C3ar1−/− male spleen cells were injected i.v. into WT or C5ar1−/− C3ar1−/− B6 females, respectively, and 10 days later, recipient spleen cells were assayed for responses to class II-restricted Dby peptide. (D) WT or C5ar1−/−C3ar1−/− mice were infected with T gondii. All C5ar1−/−C3ar1−/− mice died by day 12, whereas WT animals survived for >50 days. Spleen cells from C5ar1−/−C3ar1−/− and WT animals isolated on day 7 or 10 were stimulated with 1 μg of Toxoplasma gondii antigen and assayed for IFNγ by ELISPOT (left) or for IL-12 by ELISA (right) (n = 5 per group each time; some dots overlap). *p < 0.05 versus controls. (E) Clinical scores in WT and C5ar1−/−C3ar1−/− mice in which EAE was induced by immunization s.c. with 200 μg MOG35–55 in CFA and 200 ng of pertussis toxin. (n = 5 each group, p < 0.05). (F) Globes from WT and C5ar1−/−C3ar1−/− mice 15 days after inoculation of scratched corneas with KDS strain of herpes simplex virus (n = 5 each group). All error bars are ± SD.
Figure 4
Figure 4. Locally Produced C5a and C3a Interact with C5aR and C3aR in an Autocrine and Paracrine Fashion to Augment T Cell Immunity
(A) OT-II T cells were incubated for 1 hr with WT DCs and 0.1 μM OVA323–339 ± 10 ng/ml C5aR-A and 10 ng/ml C3aR-A and either flow separated and assayed for mRNA expression (C3, C5aR, C3aR; left and middle) or analyzed (after 24 hr) for C3aR and C5aR by flow cytometry (right); C3aR and C5aR levels on peritoneal macrophages are 14- and 13-fold higher. (B) The left side shows that complement-gene expression was assessed in purified WT T cells after 1 hr stimulation with 1 μg/ml anti-CD3 + 1 μg/ml anti-CD28 ± 10 ng/ml of C5aR-A and C3aR-A. The right side shows that C3 expression was compared between purified WT and C5ar1−/−C3ar1−/− T cells stimulated with 1 μg/ml each of anti-CD3+anti-CD28. (C) Supernatants from (B) were assayed for C5a+C3a by immunoblotting (std = 2ng). (D) CFSE-labeled WT or C3−/− H-2d Balb/c T cells stimulated in vitro for 4 days with WT or C3−/− BL/6 H-2b macrophages. Percent cells within gated (C3−/− versus WT cells, *p < 0.05). Each experiment was repeated at least once with similar results. All error bars are ± SD.
Figure 5
Figure 5. Locally Produced C5a and C3a Influence APC-T Cell Interactions through Regulating Costimulatory-Molecule Expression Levels
(A) Peritoneal macrophages and CD4+ T cells from naive WT, C3−/−, C3ar1−/−, and C5ar1−/− mice were assayed for B7.1, B7.2, CD40, or CD28, and anti-CD3+anti-CD28-stimulated CD4+ T cells were assayed for CD40L expression levels by flow cytometry. (I-Ab surface expression was also decreased [not shown].) (B) WT T cells and DCs were incubated for 1 hr at 37°C with 100 ng/ml C5aR-A or C3aR-A, and costimulatory molecule or MHC class II expression was assayed by flow cytometry. (C) The left side shows that CFSE-labeled Mar T cells were incubated with WT or Cd80−/−Cd86−/− DC and 1 μg/ml Dby peptide ± 100 ng/ml of C5a, and proliferation was assessed by CFSE dilution. In a second experiment (middle), the percentage of cells undergoing greater than one or greater than two divisions was quantified. The right side shows that OT-II T cells were incubated for 18 hr with Cd80−/−Cd86−/− or CD40−/− DCs ± 300 ng/ ml C5a, and IFNγ+ T cells were quantitated by ELISPOT (representative of two experiments; WT versus Cd80−/−Cd86−/−, p < 0.05). C5a was added once at time 0 rather than continuously as occurs with CD28 signaling. (D) WT, C3ar1−/−, C5ar1−/−, and C5ar1−/−C3ar1−/− T cells were incubated in complete RPMI with anti-CD3 (left), anti-CD3+anti-CD28 (middle), or anti-CD3 + 300 ng/ml C5a (right) and IFNγ+ cells assayed at 48 hr by ELISPOT (n = 5 each group; some dots overlap). (E) WT, C3ar1−/−, or C5ar1−/− T cells were incubated with buffer, anti-CD3+anti-CD28, or anti-CD3 + 300 ng/ml C5a and complement (C3) mRNA transcripts measured by qPCR (representative of three experiments). (F) The left side shows that WT, C3ar1−/−, or C5ar1−/− DCs were incubated for 4 hr ± 300 ng/ ml C5a, and Cd80 as well as Cd86 expression was measured by flow cytometry. Similar results were obtained in assays for I-Ab, CD40, with both DCs and macrophages and for CD40L and CD28 with T cells (data not shown). The right side shows that WT or C3−/−Hc−/− T cells were incubated with buffer, C5a, or anti-C3a+anti-C5a mAbs, and CD28 was measured as above. (G) Base pairs −991 to +72 of the human B7.1 promoter were inserted into a luciferase reporter vector GL4 and transfected into THP-1 cells by electroporation. After overnight incubation in complete medium, the cells were treated with 300 nM of C5a for 2 hr in serum-free media, and luciferase activity was measured with a Lmax Luminometer (Molecular Devices). Each experiment was repeated at least once with similar results. *p < 0.05. All error bars are ± SD.
Figure 6
Figure 6. C5aR and C3aR Ligation Activates PI3-Kγ, which in turn Promotes AKT Phosphorylation
(A) The left side shows that WT T cells were activated with anti-CD3+anti-CD28, and at progressively increasing times, buffer, C5aR-A, or C5aR-A+C3aR-A were added; extracts were analyzed for phospho-Ser473 AKT by Luminex assays (representative of two experiments). (p < 0.05). The right side shows that naive WT and C5ar1−/− C3ar1−/− T cells were incubated with 1 μg/ml of anti-CD3+anti-CD28 at 37°C and phospho-Ser473 AKT assessed at increasing times. (B) WT T cells were incubated at 37°C with anti-CD3+anti-CD28 (1 μg/ml each) for 3 min after which the cells were incubated for 20 min with buffer or 0.1 μM PI-3Kγ-specific inhibitor PI-103. Extracts were immunoblotted with anti-phospho-Ser473 AKT or total AKT mAb (representative of five experiments). (C) OT-II T cells were incubated with 0.1 μM OVA323–339, WT DCs, and 0.1 μM PI-103 ± 10 ng/ml C5a. Complement, IL-2, and IFNγ mRNAs were quantitated by qPCR. All error bars are ± SD.
Figure 7
Figure 7. Constitutive C5a and C3a Production and Signaling via the C5aR and C3aR GPCRs Influences Cell Viability In Vitro and In Vivo
(A) The left side shows that WT T cells were stained with Alexa647-labeled Ab for detection of C3aR and C5aR expression in resting T cells. The center shows that WT T cells were incubated at 37°C for 17 hr, supernatants were concentrated 10-fold, and C3a or C5a were immunoblotted. The right side shows that WT and C5ar1−/−C3ar1−/− T cells were incubated in complete RPMI 1640 and viability assessed as described in the Experimental Procedures (representative of three experiments). (B) WT and C5ar1−/−, C3ar1−/−, and C5ar1−/− C3ar1−/− T cells were incubated for 6 hr in serum-free HL-1 medium and viability assayed. (C) WT T cells were incubated at 37°C for 6 hr in HL-1 medium ± anti-C3a, anti-C5a, or anti-C3a+anti-C5a and viability assessed. (D) C3−/− and C5-deficient T cells were incubated for 6 hr in HL-1 medium ± 300 ng/ml C5a added at time 0 and 90 min. (E) Spleens from naive WT, C3ar1−/−, C5ar1−/−, and C3ar1−/−C5ar1−/− mice were isolated (three to five animals per group), total cell numbers were counted, and the CD3+ fraction was determined by flow cytometry (WT = 10%, C5ar1−/− = 5.4%, C3ar1−/− = 6.3, and C5ar1−/−C3ar1−/− = 4.1%). (F) Immediately after isolation and labeling, 106 CFSE–labeled WT T cells and CellTracker Red CMTPX-labeled C5ar1−/−C3ar1−/− T cells were adoptively cotransferred into the same SCID mice (n = 4 mice per group for each time point). Surviving cells numbers were assayed at increasing times. Repeated experiments switching the dyes gave the same results (data not shown). All experiments were performed at least twice with comparable results. *p < 0.05 WT versus C5ar1−/−C3ar1−/− cells. All error bars are ± SD.

References

    1. Alcazar I, Marques M, Kumar A, Hirsch E, Wymann M, Carrera AC, Barber DF. Phosphoinositide 3-kinase gamma participates in T cell receptor-induced T cell activation. J Exp Med. 2007;204:2977–2987. - PMC - PubMed
    1. Cain SA, Monk PN. The orphan receptor C5L2 has high affinity binding sites for complement fragments C5a and C5a des-Arg(74) J Biol Chem. 2002;277:7165–7169. - PubMed
    1. Deane JA, Fruman DA. Phosphoinositide 3-kinase: Diverse roles in immune cell activation. Annu Rev Immunol. 2004;22:563–598. - PubMed
    1. Diehl L, Den Boer AT, van der Voort EI, Melief CJ, Offringa R, Toes RE. The role of CD40 in peripheral T cell tolerance and immunity. J Mol Med. 2000;78:363–371. - PubMed
    1. Goruppi S, Ruaro E, Varnum B, Schneider C. Requirement of phosphatidylinositol 3-kinase-dependent pathway and Src for Gas6-Axl mitogenic and survival activities in NIH 3T3 fibroblasts. Mol Cell Biol. 1997;17:4442–4453. - PMC - PubMed

Publication types

MeSH terms