Review
. 2008 Aug;29(4):203-54.
doi: 10.1016/j.mam.2008.01.001. Epub 2008 Feb 1.

Thrombin

Affiliations
Review

Thrombin

Enrico Di Cera. Mol Aspects Med. 2008 Aug.

Abstract

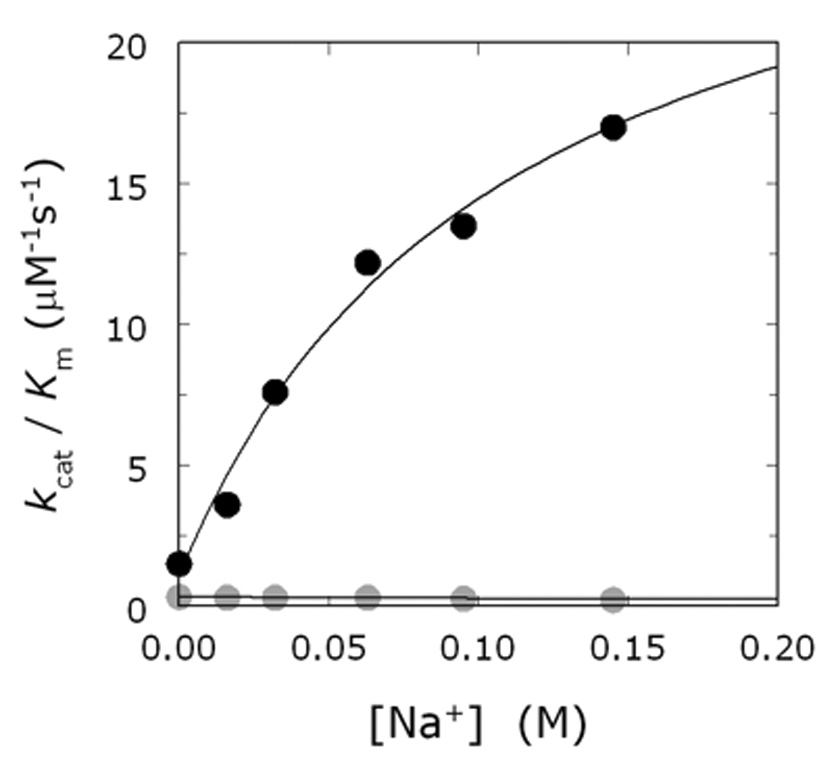
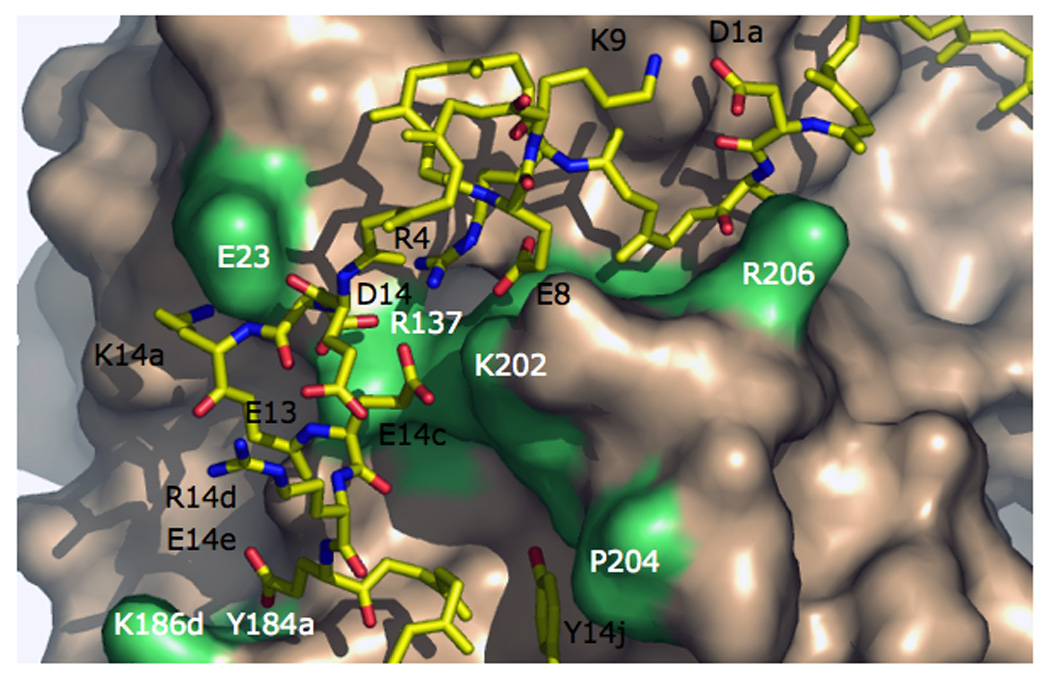
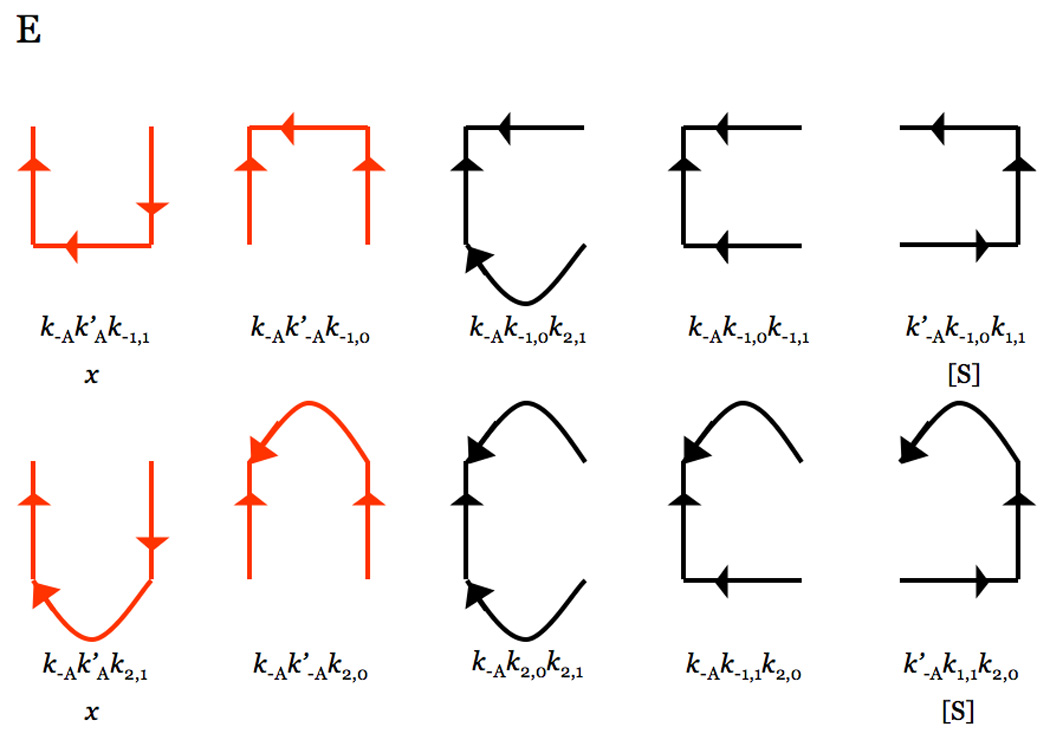
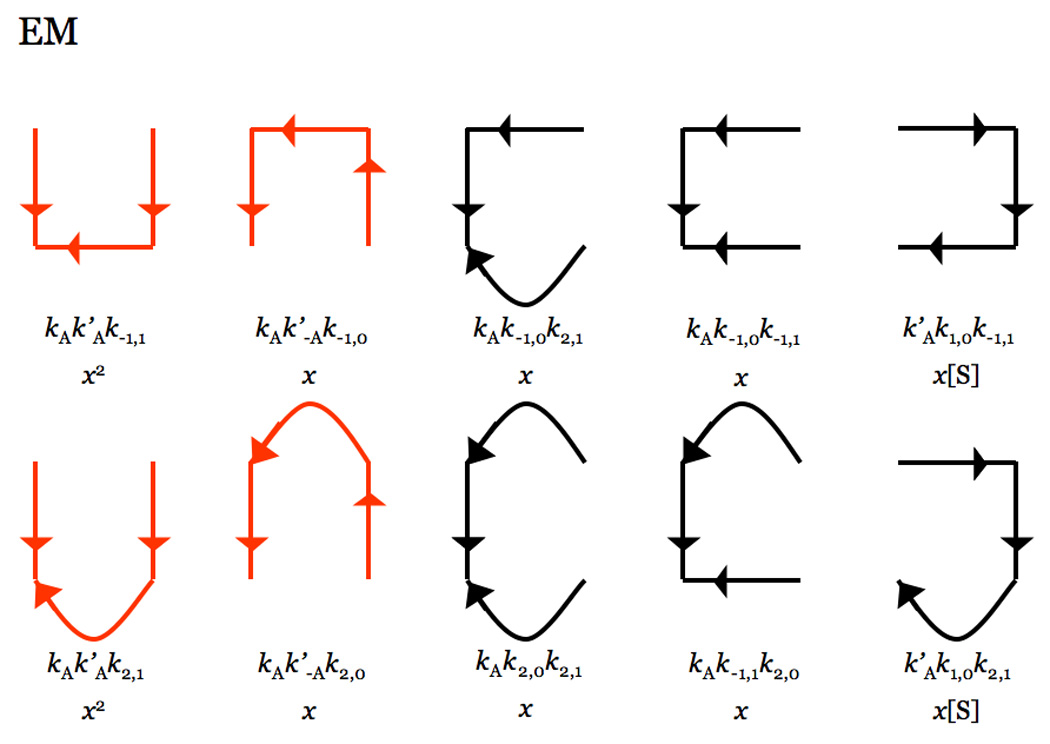
Thrombin is a Na+-activated, allosteric serine protease that plays opposing functional roles in blood coagulation. Binding of Na+ is the major driving force behind the procoagulant, prothrombotic and signaling functions of the enzyme, but is dispensable for cleavage of the anticoagulant protein C. The anticoagulant function of thrombin is under the allosteric control of the cofactor thrombomodulin. Much has been learned on the mechanism of Na+ binding and recognition of natural substrates by thrombin. Recent structural advances have shed light on the remarkable molecular plasticity of this enzyme and the molecular underpinnings of thrombin allostery mediated by binding to exosite I and the Na+ site. This review summarizes our current understanding of the molecular basis of thrombin function and allosteric regulation. The basic information emerging from recent structural, mutagenesis and kinetic investigation of this important enzyme is that thrombin exists in three forms, E*, E and E:Na+, that interconvert under the influence of ligand binding to distinct domains. The transition between the Na+ -free slow from E and the Na+ -bound fast form E:Na+ involves the structure of the enzyme as a whole, and so does the interconversion between the two Na+ -free forms E* and E. E* is most likely an inactive form of thrombin, unable to interact with Na + and substrate. The complexity of thrombin function and regulation has gained this enzyme pre-eminence as the prototypic allosteric serine protease. Thrombin is now looked upon as a model system for the quantitative analysis of biologically important enzymes.


Figures

Figure 1
Figure 1
Schematic representation of the multiple roles of thrombin in the blood and how Na+ binding influences them. Upon generation from the inactive zymogen prothrombin, thrombin partitions itself between a Na+-free slow form (40% of the population of molecules in vivo) and a Na+-bound fast form (60% of the population of molecules in vivo). The fast form is responsible for the efficient cleavage of fibrinogen leading to clot formation, and activation of factors V, VIII and XI that promote the progression of the coagulation response to vascular injury. The fast form is also responsible for the activation of PAR1, PAR3 and PAR4 leading to platelet activation and cell signaling. The slow form, on the other hand, activates efficiently the anticoagulant protein C with the assistance of the cofactor thrombomodulin. Na+ binding to thrombin is the major driving force behind the procoagulant, prothrombotic and signaling roles of the enzyme in the blood, but is not required for its anticoagulant role triggered by protein C activation. The anticoagulant function of thrombin depends on the interaction with thrombomodulin.
Figure 2
Figure 2
Enzyme activity in the presence of LiCl (gray), NaCl (white), KCl (black) or RbCl (hatched) for Hsc70 (O'Brien and McKay 1995) and thrombin (Prasad et al. 2004). Values refer to s=Kcat/Km of ATP hydrolysis for Hsc70 in the presence of 150 mM salt, relative to CsCl, or the hydrolysis of H-D-Phe-Pro-Arg-p-nitroanilide by thrombin in the presence of 200 mM salt, relative to choline chloride. The preference for K+ (Hsc70) or Na+ (thrombin) is evident from the plot.
Figure 3
Figure 3
Effect of Na+ on the cleavage of fibrinogen (black circles) and protein C (gray circles) by thrombin, under experimental conditions of 5 mM Tris, 0.1% PEG, pH 7.4 at 37 °C. Values of Kcat/Km were measured as a function of [Na+] by keeping the ionic strength constant at 145 mM with choline chloride. The data for protein C were obtained in the presence of 5 mM CaCl2 and 100 nM human thrombomodulin. Note the difference in Na+ effect between the hydrolysis of the two physiologic substrates. Continuous lines were drawn according to eq 7b in the text with parameter values: s0=1.1±0.1 µM−1s−1, s1=29±3 µM−1s−1, KA=9.2±0.6 M−1 (black circles); s0=0.32±0.02 µM−1s−1, s1=0.20±0.01 µM−1s−1, KA=9.2±0.6 M−1 (gray circles). In both cases, the value of ω=1.
Figure 4
Figure 4
Structure of thrombin bound to the active site inhibitor PPACK (stick model) and Na+ (yellow ball). The A chain (green) runs in the back of the B chain (cyan). Disulfide bonds are in orange and are numbered 1 (C1–C122), 2 (C48–C52), 3 (C168–C182), 4 (C191–C220). Relevant domains are noted. Catalytic residues (H57, D102, S195) are marked by *, and D189 is labeled. The bound Na+ is nestled between the 220-loop and the 186-loop and is within 5 Å from the side chain of D189. Numbering refers to chymotrypsin(ogen). Insertions relative to chymotrypsin are denoted by a letter in lower case following the residue number (e.g., R221a) to avoid confusion with single-site mutations. Note the position of the C-terminus of the A chain near the back of the Na+ site and the three disulfide bonds in the B chain connecting strands of the Na+ site, the primary specificity pocket and the active site.
Figure 5
Figure 5
Interactions between the A chain (stick model, residues labeled in black) and B chain (wheat surface, residues labeled in white and shown in lime) of thrombin. The A chain is stabilized by the D1a-K9 and R14d-E13 ion-pairs and the R4-E8-D14-E14c ion cluster. The interaction between the A and B chain depends on the C1–C122 bond (hidden behind R206), the ionic interactions D1a-R206, E8-E14c-K202, D14-R137, K14a-E23 and E14e-K186d-Y184a, and the hydrophobic stacking Y14j-P204. Some H-bonds are omitted for clarity. The Na+ site is located below the surface of K186d and Y184a.
Figure 6
Figure 6
Cross section of the thrombin structure showing the communication between R4 and important regions of the enzyme. The side chain of R4, stabilized by the polar contacts with E8 and E14c, is in van der Waals interaction with W29 (3.8 Å) and W207 (3.6 Å), which in turn are in hydrophobic contact with V200 (3.5 and 4.1 Å, respectively). V200 and W29 contact P198 (3.9 and 4.0 Å, respectively), which likely controls the backbone orientation of the entire sequence from S195 in the active site to F199 through the highly flexible G196–G197 linker. The benzene ring of F199 is in van der Waals interaction with F181 (4.0 Å) and Y228 (4.0 Å). This network of hydrophobic interactions enables R4 and the R4-E8-D14-E14c ion cluster to communicate long-range with the catalytic S195 (via P198), the primary specificity pocket (via Y228, D189 is right below it) and the Na+ site (via F181, the bound Na+ is in the cavity at the bottom right corner). The pivotal connections between R4 and the network are W29 and W207, whose conformation is under the influence of Na+ binding(Bah et al. 2006).
Figure 7
Figure 7
The Na+ binding site of thrombin. Shown are substrate (CPK, C in yellow), relevant residues (CPK, C in cyan), and Na+ (yellow sphere). Na+ binding orients the critical D189 for correct engagement of the substrate Arg side chain.
Figure 8
Figure 8
Hill diagrams depicting the trajectories toward each of the four species in the kinetic Scheme 1. Each trajectory contains the product of three rate constants in Scheme 1, because of the four species only three are independent due to mass conservation. Curved lines depict the irreversible reactions of product formation with rate constants k2,0 and k2,1 (see Scheme 1). Trajectories in red dominate under conditions where the rates of binding and dissociation of Na+ are fast compared to all other rates. Combination of all trajectories gives the expressions for the coefficients in eq 2aeq 2e.
Figure 8
Figure 8
Hill diagrams depicting the trajectories toward each of the four species in the kinetic Scheme 1. Each trajectory contains the product of three rate constants in Scheme 1, because of the four species only three are independent due to mass conservation. Curved lines depict the irreversible reactions of product formation with rate constants k2,0 and k2,1 (see Scheme 1). Trajectories in red dominate under conditions where the rates of binding and dissociation of Na+ are fast compared to all other rates. Combination of all trajectories gives the expressions for the coefficients in eq 2aeq 2e.
Figure 9
Figure 9
Na+ dependence of the kinetic constants s=Kcat/Km (left) and Kcat (right) for the hydrolysis of H-D-Phe-Pro-Arg-p-nitroanilide (FPR) by thrombin. Experimental conditions are: 50 mM Tris, 0.1% PEG, pH 8.0 at 25 °C. The [Na+] was changed by keeping the ionic strength constant at 400 mM with choline chloride. The data illustrate the signatures of Type II activation with both s and Kcat showing a marked Na+ dependence and changing from low, finite values, to significantly higher values. Curves were drawn using equation 7a equation 7b, with best-fit parameter values: (data at left) s0=2.3±0.1 µM−1s−1, s1=99±3 µM−1s−1, KA=38±1 M−1; (data at right) k2,0=4.7±0.2 s−1, k2,1=78±2 s−1, KA’=45±2 M−1. Also shown is the contribution of the additional term (ω−1)Λ in eq 7b (gray line, left) calculated from the reported values of kinetic rate constants (Krem et al. 2002). This term makes at most a 3% correction at low [Na+].
Figure 10
Figure 10
A,B. (A) Kinetic traces of Na+ binding to human thrombin in the 0–250 ms time scale. Shown are the traces obtained at 50 and 100 mM Na+ with the stopped-flow method using an Applied Photophysics SX20 spectrometer, with an excitation of 280 nm and a cutoff filter at 305 nm (Bah et al. 2006). Traces are averages of three determinations. Binding of Na+ obeys a two-step mechanism, with a fast phase completed within the dead time (<0.5 ms) of the spectrometer, followed by a single-exponential slow phase. The kobs for the slow phase decreases with increasing [Na+] (Figure 11A). (B) Kinetic traces of Na+ binding to human thrombin in the 0–700 µs time scale. Shown are the traces obtained at 36 and 91 mM Na+ with the continuous-flow method as single determinations with an exposure time of 3 s. Binding of Na+ in the 0–700 µs time scale obeys a single-exponential phase with a kobs increasing linearly with [Na+] (Figure 11B). This resolves the fast phase detected with the stopped-flow method and shown in (A). Experimental conditions for the two methods are: 5 mM Tris, 0.1% PEG8000, pH 8.0 at 25 °C. The thrombin concentration was 50 nM for the stopped-flow measurements and 40 µM for the continuous-flow measurements. The [Na+], as indicated, was changed by keeping the ionic strength constant at 400 mM with choline chloride. Continuous lines were drawn using the expression a +bexp (−kobst) with best-fit parameter values: (A) a=8.944±0.001 V, b=−0.10±0.01 V, kobs=111±9 s−1 ([Na+]=50 mM); a=9.427±0.001 V, b=−0.29±0.01 V, kobs=96±6 s−1 ([Na+]=100 mM). (B) a=0.417±0.002, b=−0.072±0.02, kobs=7±2 ms−1 ([Na+]=36 mM); a=0.477±0.002, b=−0.10±0.03, kobs=10±2 ms−1 ([Na+]=91 mM). All data were collected at least in duplicate.
Figure 11
Figure 11
A,B. Values of kobs vs [Na+] for the slow and fast phases of fluorescence change due to Na+ binding to thrombin shown in Figure 10. Shown are the results pertaining to the stopped-flow (A) and continuous-flow (B) measurements. Note the different time scale between the two panels. Experimental conditions are given in the legend to Figure 1. Continuous lines were drawn according to eq 8 and eq 9 in the text, with best-fit parameter values: k1=67±7 s−1, k−1=69±6 s−1, kA=56,000±200 M−1s−1, k−A=4,800±200 s−1.
Figure 12
Figure 12
Ribbon plot of thrombin in the Na+-bound form, portraying the structure 1SG8 (Pineda et al. 2004a) with the active site in the front (A) or rotated 180° along the y axis (B). Shown are the side chains of the catalytic residues H57, D102 and S195, and the side chain of D189. Na+ is rendered as a green ball. The nine Trp residues of the enzyme are shown with their side chains in orange. The contribution of these residues to the fluorescence change induced by Na+ binding is discussed in the text. The A chain was removed for clarity.
Figure 13
Figure 13
Fluorescence change induced by Na+ binding to wild-type and the Phe mutants of all nine Trp residues of human thrombin. Shown are the values of the total change in intrinsic fluorescence (black bars), or the amplitude of the fast phase (grey bars). All values are expressed as % change relative to the baseline. Experimental conditions are: 50 nM thrombin, 5 mM Tris, 0.1% PEG, pH 8.0 at 15 °C.
Figure 14
Figure 14
Surface representation depicting the structural organization of the residues promoting ligand recognition to the fast (red) or slow (green) form of thrombin. The structure refers to 4HTC (Rydel et al. 1991) with thrombin oriented as in Figure 4. The inhibitor hirudin was removed for clarity. Shown are the residues whose Ala substitution affects FPR (Pineda et al. 2004a), hirudin (Mengwasser et al. 2005) or fibrinogen (Di Cera et al. 2007) recognition >10-fold in either form and concurrently change the difference in specificity between the slow and fast forms >3-fold. Also shown in red are residues D189, E217, D222 and Y225 in the allosteric core controlling Na+ binding to thrombin (Pineda et al. 2004a). Trp residues visible in this orientation are rendered in yellow. Note how the binding of Na+ produces long-range effects that cross the medial portion of the B chain where most of the Trp residues are located. These residues are linked to the structural conduits for allosteric communication between the two domains.
Figure 15
Figure 15
Structural changes induced by Na+ binding to thrombin depicted by the structures of the Na+-free slow (1SGI, yellow) and Na+-bound fast (1SG8, marine) forms. The main changes induced by Na+ (yellow sphere) binding are: formation of the R187-D222 ion-pair that causes a shift in the backbone O atom of R221a, reorientation of D189 that accounts for the change in substrate binding, shift of the side chain of E192, and shift in the position of the Oγatom of S195 that accounts for the change in Kcat. Also shown are the changes in the water network connecting the Na+ site to the active site S195. The water molecules in the fast form (red spheres) are organized in a network that connects Na+ to the side chain of D189 and continues on to reach the Oγatom of S195. A critical link in the network is provided by a water molecule that H-bonds to S195 and E192. This water molecule is removed in the slow form, causing a reorientation of E192. The connectivity of water molecules in the Na+-free form (green spheres) is further compromised by the lack of Na+ and proper anchoring of the side chain of D189. H-bonds are shown by broken lines and refer to the fast form.
Figure 16
Figure 16
Space filling model of thrombin in the Bode orientation (active site, center; exosite I, right; exosite II, top left; Na+ site, bottom left; 60-loop, top) depicting the structure of E*. The surface is color-coded according to the spectrum (N-terminus blue, C-terminus red). Note how the collapse of the 215–219 β-strand (red) against the 60-loop (cyan) completely occludes access to the active site. Details of the conformation of E* and its conversion into E are given in Figure 24.
Figure 17
Figure 17
(A, B, C). Surface rendering of the pore of entry to the Na+ binding site of human thrombin in the structure 1SG8 (Pineda et al. 2004a) (A), compared with the same region in murine thrombin (B) and the thrombin chimera (C). Residues lining the pore are color coded according to their physical properties (red=positively charged, blue=negatively charged, orange=hydrophobic, white=all others). In the human enzyme, the pore is defined by residue D222 in the 220-loop and the sequence PDEGKR from P186 to R187 in the 186-loop (Table 2) (A). In murine thrombin (B), residue 222 is Lys and the corresponding sequence in the 186-loop is VNDTKR (Table 2). The side chain of K222 completely occludes the pore. The side chain of N186a is glycosylated (NAG). Occlusion of the pore is also seen in the thrombin chimera (C), in which the human enzyme carries all residues around the pore as in murine thrombin. There is no glycosylation of N196a in the chimera. (D, E, F). Architecture of the pore of entry to the Na+ binding site in the same orientation as shown in the surface rendering (panels A, B, C), with relevant residues rendered in CPK model (C in yellow) and the 2Fo-Fc electron density maps contoured at the 0.7 σ level for the structures presented in this study (panels E, F). The human enzyme (D) shows the pore wide open, whereas K222 in murine thrombin (E) occludes the pore and positions the Nζ atom within H-bonding distance from K185, D186b and K186d. The backbone O atom of residue 186b is flipped relative to the position assumed in the fast form of the human enzyme. Also shown is the indole side chain of W20, which is Ser in human thrombin, as a structural signature of the murine enzyme. K222 in the thrombin chimera (F) is positioned as in the murine thrombin structure.
Figure 18
Figure 18
Overlay of key residues in murine thrombin (CPK, with C in yellow) and in the fast form (CPK, with C in green) of human thrombin (Pineda et al. 2004a). H-bonds (broken lines) refer to the murine thrombin structure. The presence of K222 in murine thrombin stabilizes the conformation in a fast-like form. The Oγ atom of the catalytic S195 is within H-bonding distance (3.05 Å) from H57. This H-bond is present in the fast form of the human enzyme (3.09 Å), but is broken (3.70 Å) in the Na+-free slow form (Pineda et al. 2004a). The side chain of D189 in the primary specificity pocket is oriented optimally for coordination of Arg of substrate, as seen in the fast form. The conformations of D189 and S195 are maintained by H-bonding interactions mediated by water molecules, as in the fast form of the human enzyme. However, only seven water moleluces (red balls) are present in this region of the murine thrombin structure, as opposed to Na+ (green ball) and eleven water molecules (cyan balls) present in the fast form of the human enzyme (Pineda et al. 2004a). The presence of K222 in murine thrombin pushes R187 away and closer (2.55 Å) to D221. The Nζ atom of K222 and the Oδ1 atom of D221 H-bond to water w153, which in turn stabilizes water w51 in a position equivalent (<1 Å away) to the bound Na+ in the fast form (green ball) and in contact with the backbone O atoms of R221a (2.77 Å) and K224 (2.61 Å). The H-bonding network around water w51 mimics that seen around the bound Na+ in the fast form of the human enzyme (Pineda et al. 2004a) and establishes a connection to the Oδ2 atom of D189 via water w97. The Oδ1 atom of D189 is held in place by a H-bond with water w55 (2.74 Å). S195 is fixed in its orientation by a water mediated contact with the Oε1 atom of E192, with water w63 positioned 3.19 Å away from the Oγ atom of S195 and 2.82 Å away from the the Oε1 atom of E192. The only two waters molecules, w141 and w142, between D189 and S195 are too far away from either residue. Hence, murine thrombin lacks the connectivity between the primary specificity pocket and the catalytic triad seen in the fast form of the human enzyme.
Figure 19
Figure 19
Space filling model of thrombin in the Bode orientation (active site, center; exosite I, right; exosite II, top left; Na+ site, bottom left; 60-loop, top) depicting the structural organization of the epitopes recognizing protein C in the absence (left) or presence (right) of thrombomodulin. Residues affected by Ala replacement are color coded based on the log change in the value of s=Kcat/Km for protein C activation: blue, −1.5/−0.5 units (1/30- to 1/3- fold change in s); cyan, −0.5/0.5 units (1/3- to 3- fold change in s); green, 0.5/1.5 units (3- to 30- fold change in s); yellow, 1.5/2.5 units (30- to 300-fold chage in s); red, >2.5 units (>300-fold change in s). Residues not subject to Ala-scanning mutagenesis are in gray. Crucial residues are labeled. The epitope in the absence of thrombomodulin is split into one domain providing favorable interactions (residues in yellow and red: visible are Y60a, T172, D189, G193 and K224) and a second domain providing steric/electrostatic hindrance (residues in blue: from top to bottom, F60h, R35 and P37). In the presence of thrombomodulin, the shape of the epitope changes drastically and only Y60a and D189 make significant contribution to protein C recognition. The region of unfavorable contributions to recognition (residues in blue at left) disappears.
Figure 20
Figure 20
A–D. Structures of murine thrombin in complex with fragments of murine PAR3 (A,C) and PAR4 (B,D). (A,B) Thrombin is rendered in surface representation (wheat) with the residues <4 Å from the bound fragment of PAR3 or PAR4 (stick model) colored in light blue. The orientation is centered on exosite I (A) or the active site (B). The orientation in (A) is obtained from (B) by ~90° rotation along the y-axis. Electron density maps (green mesh) are contoured at 1.0 (B) or 0.7 (D) σ. (C,D) Details of the molecular contacts at the thrombin-PAR interface, with hydrophobic regions of the thrombin epitope colored in orange and polar regions colored in light blue. H-bonds are depicted as broken lines. Residues involved in contacts <4 Å are listed in Table 1 and are labeled in black for thrombin and red for PAR. (C) The cleaved fragment of PAR3 engages exosite I through polar and hydrophobic interactions. (D) The fragment of PAR4 comprising the scissile bond makes extensive interactions with the active site moiety of the enzyme utilizing the P56 and P58 clamp at the P2 and P4 positions. After exiting the active site, the fragment folds into a short helical turn and is deflected away from exosite I and to the autolysis loop right below the active site region.
Figure 21
Figure 21
Allosteric effect induced by binding of the cleaved fragment of murine PAR3 (stick model in gold) to exosite I of murine thrombin (ribbon model in light green) on the conformation of the 60-loop (blue) and the position of W60d. Comparison with the free structure of murine thrombin (ribbon model in wheat, with 60-loop and W60d in red) shows a significant upward shift of the 60aYPPWDK60f region of the 60-loop and a 180° flip of the indole ring of W60d. The change produces complete aperture of the active site to facilitate substrate diffusion. The allosteric communication between exosite I and the 60-loop documented in the thrombin-PAR3 structure may be relevant to the interaction of thrombin with other exosite I ligands, like thrombomodulin.
Figure 22
Figure 22
Putative ternary complex of thrombin, cleaved PAR3 and PAR4 derived from an overlay of the crystal structures of the murine thrombin-PAR4 and thrombin-PAR3 complexes. Thrombin (green) refers to the thrombin-PAR4 complex. Binding of cleaved PAR3 (gold) to exosite I does not interfere with binding of PAR4 (red) to the active site of the enzyme. Cleaved PAR3 may therefore act as a cofactor of PAR4 cleavage by thrombin.
Figure 23
Figure 23
A–B. Structure of the human thrombin mutant D102N in complex with the extracellular fragment of human PAR1. (A) Thrombin is rendered in surface representation (wheat) with residues <4 Å from the bound fragment of PAR1 (stick model) colored in light blue. The orientation is centered on the 30-loop that separates exosite I on the right from the active site cleft on the left. The 60-loop occupies the upper rim of the active site. The electron density 2F0-Fc map (green mesh) is contoured at 1.0 σ. (B) Details of the molecular contacts at the thrombin-PAR1 interface, with hydrophobic regions of the thrombin epitope colored in orange and polar regions colored in light blue. H-bonds are depicted as broken lines. Residues involved in contacts <4 Å are listed in Table 1 and are labeled in black for thrombin and red for PAR1. The extracellular fragment of PAR1 engages exosite I through polar and hydrophobic interactions.
Figure 24
Figure 24
Allosteric effect induced by binding of the extracellular fragment of PAR1 (stick model in gold) to exosite I of thrombin (ribbon model in light green) on the conformation of the 215–219 β-strand and the 220-loop (blue). The position of W215 and R221a is indicated as a stick model. Thrombin is shown in the standard Bode orientation (Bode et al. 1992) with the active site cleft in the middle and exosite I to the right. Comparison with the free structure of thrombin (ribbon model in wheat, with the 215–219 β-strand and the 220-loop, W215 and R221a in red) shows a drastic rearrangement that pushes the 215–219 β-strand back >6 Å. W215 and R221a relocate >9 Å to restore access to the active site and primary specificity pocket that was obliterated in the free form‥ The allosteric communication between exosite I and the 215–219 β-strand and 220-loop spans almost 30 Å across the thrombin molecule (see also Figure 25) and reveals a possible mechanism for the conversion of thrombin from its inactive form E* into the active form E.
Figure 25
Figure 25
Molecular basis of the allosteric communication between exosite I and the 215–219 β-strand and 220-loop spanning almost 30 Å across the thrombin molecule (see also Figure 24). The extracellular fragment of PAR1 is rendered as a stick model with C atoms in yellow and the thrombin residues in the PAR1 bound form are rendered as stick models with C atoms in green. Residues of the free form of thrombin are rendered as stick models uniformly colored in light green. Relevant H-bonds are indicated as broken lines. The allosteric communication initiates with a rotation of the benzene ring of F34 and a shift in the side chain of R73 (labeled in black, as all other thrombin residues) in exosite I due to binding of PAR1 via F55, Y52 and D50 (labeleled in red). The changes propagate to the 141–146 β-strand via M32 and Q151. In turn, that re-establishes H-bond connections with the 191–193 β-strand, restores the oxyanion hole and the orientation/location of the C191:C220 disulfide bond, which relocates the entire 215–219 β-strand and 220-loop in their canonical positions to free access to the active site and the primary specificity pocket. W215 folds back almost 10 Å into the aryl binding site, relinquishing its hydrophobic interaction with the catalytic H57 (the catalytic D102 and S195 are also shown for completeness). R221a leaves the interior of the primary specificity pocket where it binds to D189 (not shown) and moves >9 Å to the surface to engage E146 in a strong bidentate ion-pair. E146 is disordered in the free structure. Additional changes involving the 186-loop restoring access to the Na+ binding site are omitted for clarity. The allosteric communication documented in the structure of the thrombin-PAR1 complex relative to the free form of the enzyme is testimony to the flexibility of the thrombin fold and prove that the various forms of the enzyme (E*, E and E:Na+) interconvert under the influence of ligand binding to distinct domains.
Figure 26
Figure 26
Specificity constants Kcat/Km for the hydrolysis of fibrinogen and protein C, in the presence of 10 nM thrombomodulin and 5 mM CaCl2, under experimental conditions of 5 mM Tris, 0.1% PEG, 145 mM NaCl, pH 7.4 at 37 °C. Plotted are the wild-type (gray) and 80 Ala mutants of thrombin. Safety and potency of an anticoagulant thrombin mutant for in vivo applications demand <0.1% activity toward fibrinogen and >10% activity toward protein C compared to wild-type. These boundaries define a target region in the plot where mutations should map. W215A and E217A are the most promising single Ala mutants. Combination of the two mutations in the W215A/E217A produces additivity and a construct with the required anticoagulant profile.
Scheme 1
Scheme 1

References

    1. Adema CM, Hertel LA, Miller RD, Loker ES. A family of fibrinogen-related proteins that precipitates parasite-derived molecules is produced by an invertebrate after infection. Proc Natl Acad Sci U S A. 1997;94:8691–8696. - PMC - PubMed
    1. Adrogue HJ, Madias NE. Hypernatremia. N Engl J Med. 2000a;342:1493–1499. - PubMed
    1. Adrogue HJ, Madias NE. Hyponatremia. N Engl J Med. 2000b;342:1581–1589. - PubMed
    1. Akhavan S, Mannucci PM, Lak M, Mancuso G, Mazzucconi MG, Rocino A, Jenkins PV, Perkins SJ. Identification and three-dimensional structural analysis of nine novel mutations in patients with prothrombin deficiency. Thromb Haemost. 2000;84:989–997. - PubMed
    1. Akhavan S, Rocha E, Zeinali S, Mannucci PM. Gly319 --> arg substitution in the dysfunctional prothrombin Segovia. Br J Haematol. 1999;105:667–669. - PubMed

Publication types

LinkOut - more resources