

Sleep-wake behavior and responses to sleep deprivation of mice lacking both interleukin-1 beta receptor 1 and tumor necrosis factor-alpha receptor 1
- PMID: 18329246
- PMCID: PMC4164115
- DOI: 10.1016/j.bbi.2008.02.001
Sleep-wake behavior and responses to sleep deprivation of mice lacking both interleukin-1 beta receptor 1 and tumor necrosis factor-alpha receptor 1
Abstract
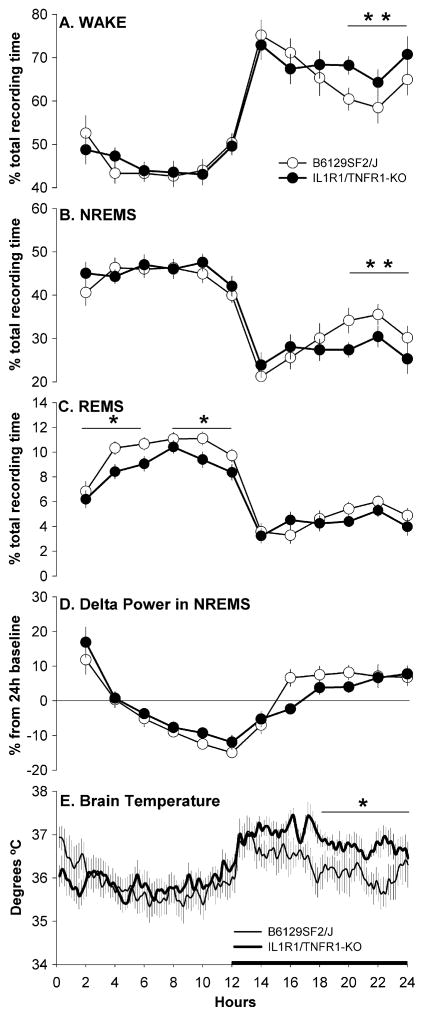
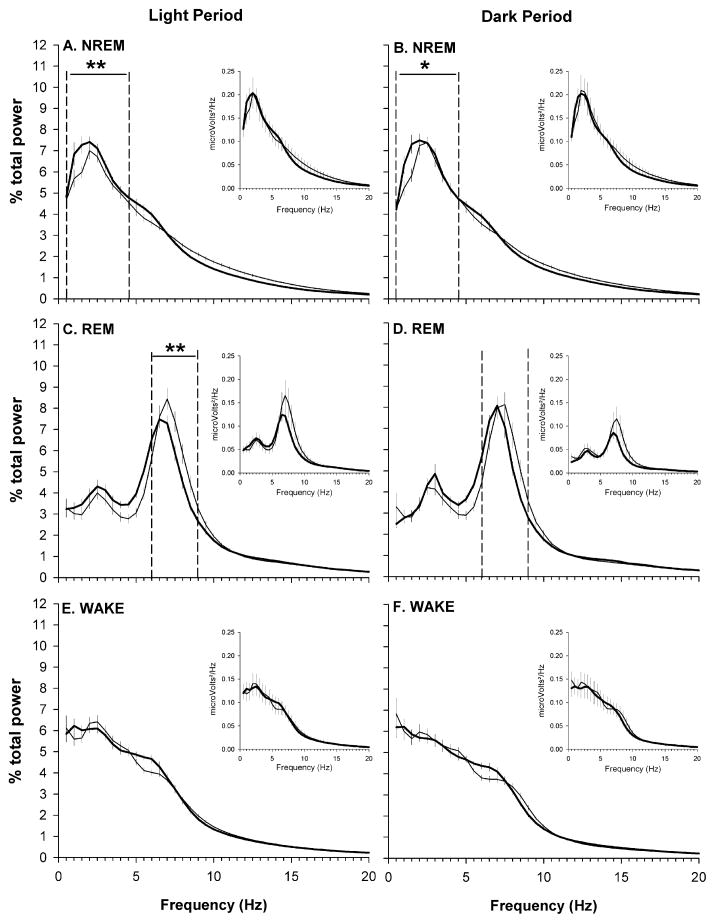
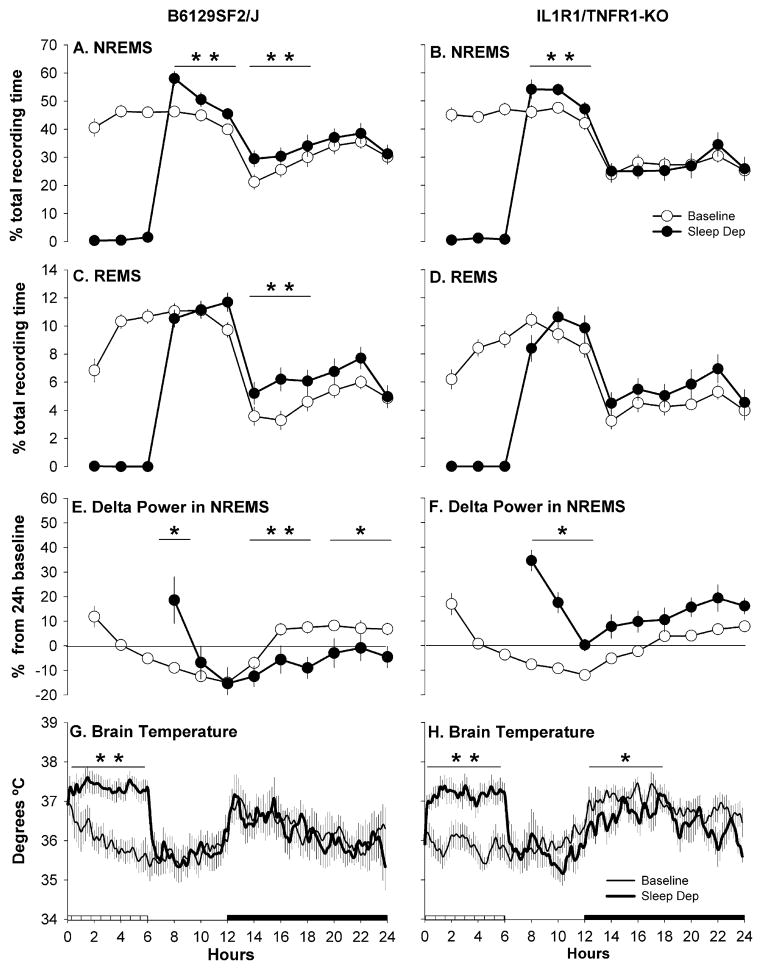
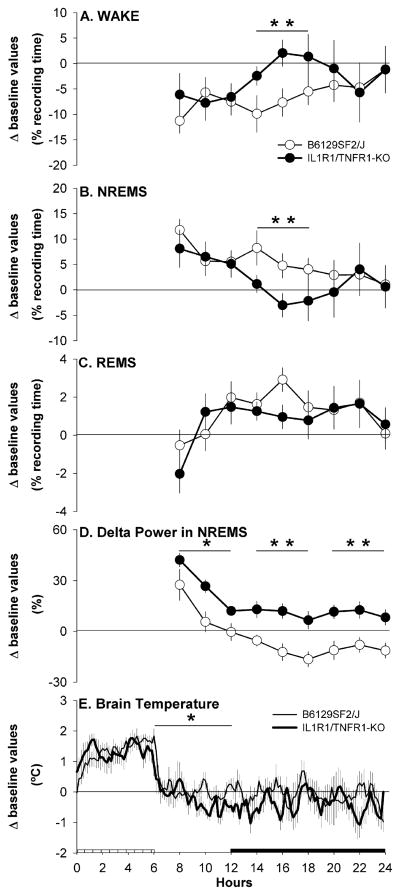
Data indicate that interleukin (IL)-1 beta and tumor necrosis factor-alpha (TNFalpha) are involved in the regulation of non-rapid eye movement sleep (NREMS). Previous studies demonstrate that mice lacking the IL-1 beta type 1 receptor spend less time in NREMS during the light period, whereas mice lacking the p55 (type 1) receptor for TNFalpha spend less time in NREMS during the dark period. To further investigate roles for IL-1 beta and TNFalpha in sleep regulation we phenotyped sleep and responses to sleep deprivation of mice lacking both the IL-1 beta receptor 1 and TNFalpha receptor 1 (IL-1R1/TNFR1 KO). Male adult mice (IL-1R1/TNFR1 KO, n=14; B6129SF2/J, n=14) were surgically instrumented with EEG electrodes and with a thermistor to measure brain temperature. After recovery and adaptation to the recording apparatus, 48 h of undisturbed baseline recordings were obtained. Mice were then subjected to 6h sleep deprivation at light onset by gentle handling. IL-1R1/TNFR1 KO mice spent less time in NREMS during the last 6h of the dark period and less time in rapid eye movement sleep (REMS) during the light period. There were no differences between strains in the diurnal timing of delta power during NREMS. However, there were strain differences in the relative power spectra of the NREMS EEG during both the light period and the dark period. In addition, during the light period relative power in the theta frequency band of the REMS EEG differed between strains. After sleep deprivation, control mice exhibited prolonged increases in NREMS and REMS, whereas the duration of the NREMS increase was shorter and there was no increase in REMS of IL-1R1/TNFR1 KO mice. Delta power during NREMS increased in both strains after sleep deprivation, but the increase in delta power during NREMS of IL-1R1/TNFR1 KO mice was of greater magnitude and of longer duration than that observed in control mice. These results provide additional evidence that the IL-1 beta and TNFalpha cytokine systems play a role in sleep regulation and in the alterations in sleep that follow prolonged wakefulness.
Figures
Similar articles
-
Sleep-wake behavior and responses of interleukin-6-deficient mice to sleep deprivation.Brain Behav Immun. 2005 Jan;19(1):28-39. doi: 10.1016/j.bbi.2004.02.003. Brain Behav Immun. 2005. PMID: 15581736
-
Sleep-wake behavior and responses to sleep deprivation and immune challenge of protein kinase RNA-activated knockout mice.Brain Behav Immun. 2024 Oct;121:74-86. doi: 10.1016/j.bbi.2024.07.027. Epub 2024 Jul 21. Brain Behav Immun. 2024. PMID: 39043346 Free PMC article.
-
Sleep and body temperature in TNFα knockout mice: The effects of sleep deprivation, β3-AR stimulation and exogenous TNFα.Brain Behav Immun. 2019 Oct;81:260-271. doi: 10.1016/j.bbi.2019.06.022. Epub 2019 Jun 17. Brain Behav Immun. 2019. PMID: 31220563 Free PMC article.
-
Counterpointing the functional role of the forebrain and of the brainstem in the control of the sleep-waking system.J Sleep Res. 2004 Sep;13(3):179-208. doi: 10.1111/j.1365-2869.2004.00412.x. J Sleep Res. 2004. PMID: 15339255 Review.
-
Delta wave power: an independent sleep phenotype or epiphenomenon?J Clin Sleep Med. 2011 Oct 15;7(5 Suppl):S16-8. doi: 10.5664/JCSM.1346. J Clin Sleep Med. 2011. PMID: 22003323 Free PMC article. Review.
Cited by
-
Potential Role of Sleep Deficiency in Inducing Immune Dysfunction.Biomedicines. 2022 Sep 1;10(9):2159. doi: 10.3390/biomedicines10092159. Biomedicines. 2022. PMID: 36140260 Free PMC article. Review.
-
Neuroinflammation, Sleep, and Circadian Rhythms.Front Cell Infect Microbiol. 2022 Mar 22;12:853096. doi: 10.3389/fcimb.2022.853096. eCollection 2022. Front Cell Infect Microbiol. 2022. PMID: 35392608 Free PMC article. Review.
-
Effects of sleep fragmentation on sleep and markers of inflammation in mice.Comp Med. 2014 Feb;64(1):13-24. Comp Med. 2014. PMID: 24512957 Free PMC article.
-
Body Temperature Measurements for Metabolic Phenotyping in Mice.Front Physiol. 2017 Jul 31;8:520. doi: 10.3389/fphys.2017.00520. eCollection 2017. Front Physiol. 2017. PMID: 28824441 Free PMC article.
-
Theta-gamma coupling emerges from spatially heterogeneous cholinergic neuromodulation.PLoS Comput Biol. 2021 Jul 30;17(7):e1009235. doi: 10.1371/journal.pcbi.1009235. eCollection 2021 Jul. PLoS Comput Biol. 2021. PMID: 34329297 Free PMC article.
References
-
- Bazhenov M, Timofeev I, Steriade M, Sejnowski TJ. Self-sustained rhythmic activity in the thalamic reticular nucleus mediated by depolarizing GABAA receptor potentials. Nat Neurosci. 1999;2:168–174. - PubMed
-
- Beattie EC, Carroll RC, Yu X, Morishita W, Yasuda H, von Zastrow M, Malenka RC. Regulation of AMPA receptor endocytosis by a signaling mechanism shared with LTD. Nat Neurosci. 2000;3:1291–1300. - PubMed
-
- Benveniste EN. Inflammatory cytokines within the central nervous system: sources, function, and mechanisms of action. Am J Physiol. 1992;263:C1–C16. - PubMed
-
- Borbély AA. A two process model of sleep regulation. Hum Neurobiol. 1982;1:195–204. - PubMed
-
- Breder CD, Dinarello CA, Saper CB. Interleukin-1 immuno-reactive innervation of the human hypothalamus. Science. 1988;240:321–324. - PubMed
Publication types
MeSH terms
Substances
Grants and funding
LinkOut - more resources
Full Text Sources
Molecular Biology Databases
Research Materials
