

doi: 10.1016/j.jneuroim.2008.01.003.
Epub 2008 Mar 10.
Chronic CXCL10 alters the level of activated ERK1/2 and transcriptional factors CREB and NF-kappaB in hippocampal neuronal cell culture
Affiliations
- PMID: 18329727
- PMCID: PMC2396565
- DOI: 10.1016/j.jneuroim.2008.01.003
Item in Clipboard
Chronic CXCL10 alters the level of activated ERK1/2 and transcriptional factors CREB and NF-kappaB in hippocampal neuronal cell culture
J Neuroimmunol.
2008 Mar.
Abstract
Signal transduction pathways may be important targets of chemokines during neuroinflammation. In the current study, Western blot analyses show that in rat hippocampal neuronal/glial cell cultures chronic CXCL10 increases the level of protein for ERK1/2 as well as for the transcriptional factors CREB and NF-kappaB. Bcl-2, an anti-apoptotic protein whose expression can be regulated by a pathway involving ERK1/2, CREB and NF-kappaB, was also increased in the CXCL10 treated cultures. These results implicate a role for ERK1/2, CREB and NF-kappaB in effects of CXCL10 on hippocampal cells and suggest that chronic CXCL10 may have a protective role during certain neuroinflammatory conditions.
Figures

Chronic CXCL10 treatment alters the level of enolase and GFAP in hippocampal cultures. (A) Digitized phase contrast images of live control and CXCL10-treated hippocampal cultures. Clusters of phase bright neurons and their phase dark processes are evident under all treatment conditions. The morphological features of the cultures and neurons were similar in all treatment groups. (B) Graph showing mean normalized values (±SEM) for total protein levels in control and CXCL10-treated cultures. Protein levels in CXCL10-treated cultures were normalized to levels in control cultures. Control values are equal to one and represented by the dotted line. (C). Digitized images (Hoffman optics) of control and CXCL10-treated hippocampal cultures immunostained with an antibody to GFAP. The cultures were plated at low neuronal density so that the astrocyte population was clearly visible. The astrocyte layer forms the substratum upon which the neurons grow and is masked by the neuronal population in the denser plated cultures used for protein analyses. The white arrow in the images indicates one of the neurons. The black arrow indicates one of the astrocytes. The calibration bar also applies to A. (D-F) Graphs showing mean values (±SEM) for the relative level of several proteins assessed by Western blot in control (n=6) and chronic CXCL10-treated cultures (n=6 for each CXCL10 concentration). CXCL10 at 250 nM increased the levels of GFAP (D), neuron specific enolase (E) and β-actin (F). The results for β-actin are presented as the ratio of CXCL10-treated to control values. Measured values for neuron specific enolase and GFAP were normalized to the β-actin level in the same lane and then the normalized value for each treatment group was normalized to the normalized value for the control group run on the same gel (see Methods; 50 nM, striped bar; 100 nM, white bar; 250 nM, black bar). The dashed lines represent control levels, which are equal to 1. Statistical significance (*), calculated by one group t-test, was set at p ≤ 0.05. (G) Representative Western blots of β-actin, neuron specific enolase and GFAP.

Chronic CXCL10 alters the levels of phosphorylated and total ERK. (A-C) Graphs showing mean normalized values (±SEM) for the relative level of pERK (A), ERK (B) (normalized to β-actin), and pERK/ERK (C) assessed by Western blot in control (n=6) and chronic CXCL10 treated cultures (n=6 for each CXCL10 concentration; 100 nM, white; 250 nM, black). The dashed lines represent control levels. Statistical significance (*), calculated by one group t-test, was set at p ≤ 0.05. (D) Representative Western blots of pERK and ERK.
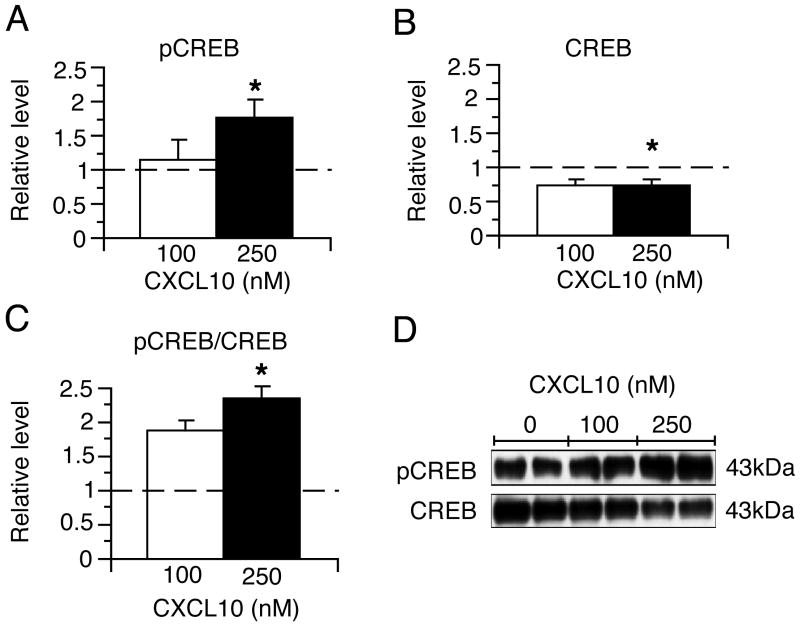
Chronic CXCL10 alters the levels of phosphorylated and total CREB. (A-C) Graphs showing mean normalized values (±SEM) for the relative level of phosphorylated and total CREB assessed by Western blot in control (n=6) and chronic CXCL10 treated cultures (n=6 for each CXCL10 concentration; 100 nM, white bar; 250 nM, black bar). The dashed lines represent control levels. Statistical significance (*), calculated by one group t-test, was set at p ≤ 0.05. (D) Representative Western blots of pCREB and CREB.
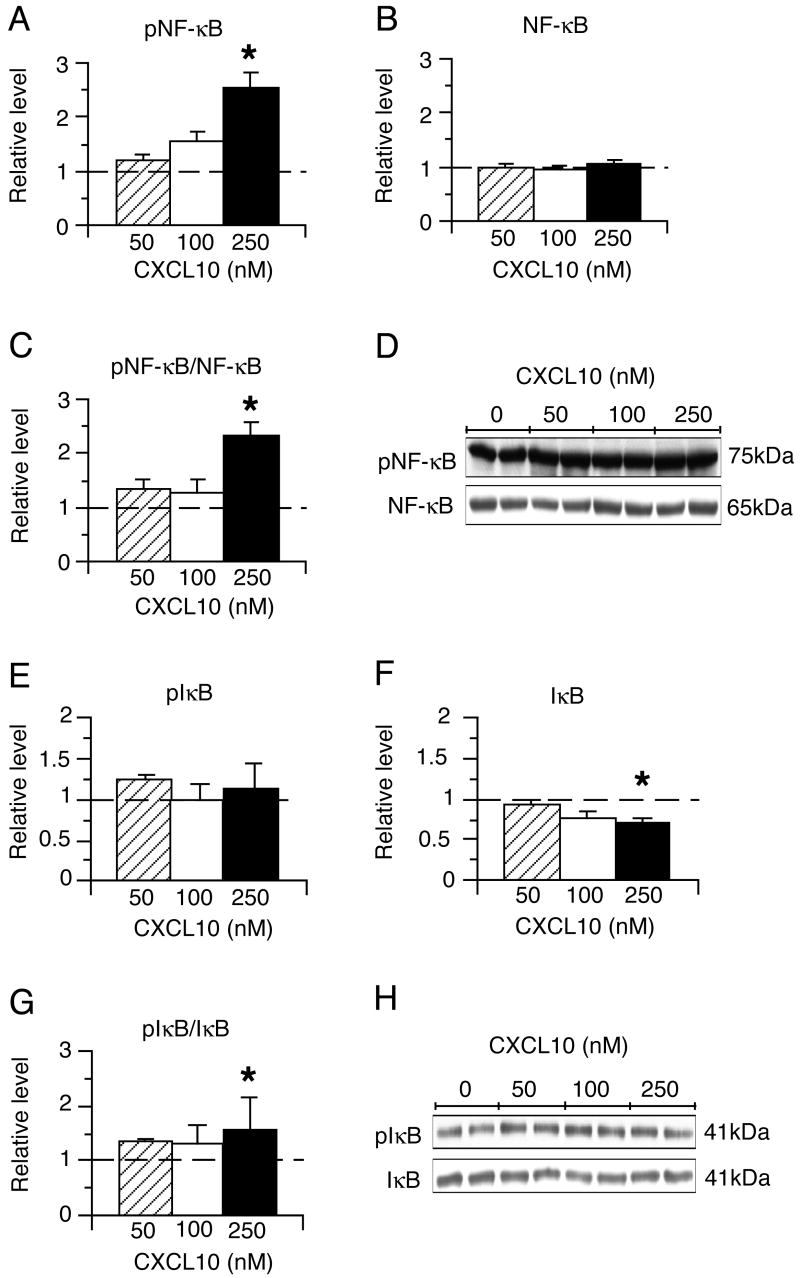
Chronic CXCL10 increases the level of activated NF-κB. (A-C,E-G) Graphs showing mean normalized values (±SEM) for the relative level of phosphorylated NF-κB (A), total NF-κB (B), the ratio pNF-κB/NF-κB (C), pIκB (E), total IκB (F), and the ratio of pIκB/IκB (G) assessed by Western blot in control (n=6) and chronic CXCL10 treated cultures (n=6 for each CXCL10 concentration; 50 nM, striped bar; 100 nM, white bar; 250 nM, black bar). The dashed lines represent control levels. Statistical significance (*), calculated by one group t-test, was set at p ≤ 0.05. Representative Western blots of pNF-κB and NF-κB (D); pIκB and IκB (H).
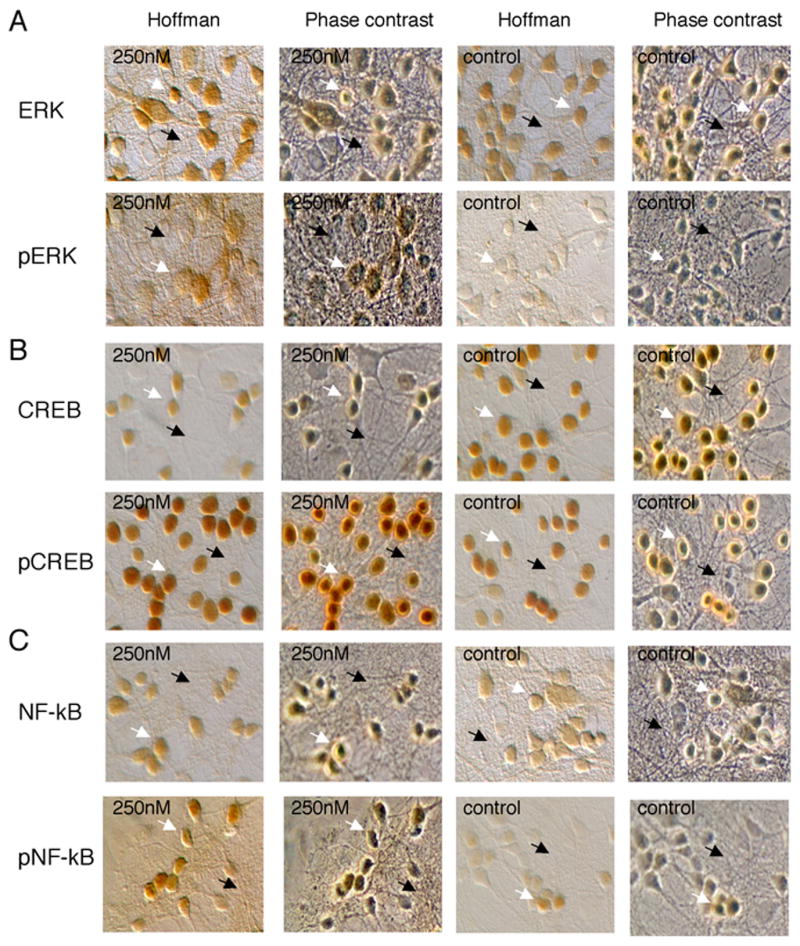
Immunostaining for signal transduction proteins. (A) Digitized images of microscopic fields after immunostaining for ERK (A, top panel,) pERK (A, bottom panel), CREB (B, top panel), pCREB (B, bottom panel), NF-κB (C, top panel) and pNF-κB. Immunostaining is shown under Hoffman and phase contrast optics. Immunostained cells are evident under Hoffman optics, whereas all cells present in the field are evident under phase contrast optics. The prominent immunostaining of neurons with little or no staining of the surrounding glial cells was observed. The neuronal cells are visible under both Hoffman and phase contrast optics, whereas glial cells are visible only under phase contrast optics. Scale bar = 20 μm and applies to all images. White arrows indicate representative neurons and black arrows indicate representative glial cells.
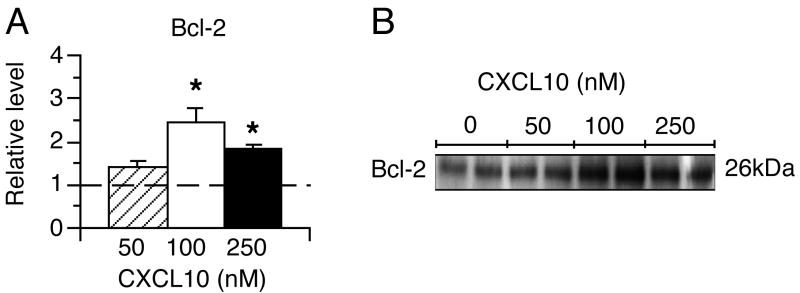
Chronic CXCL10 increases Bcl-2 and SOD2. (A,C) Graph showing the mean normalized value (±SEM) for the relative level of Bcl-2 (A) and SOD2 (tetramer) (C) assessed by Western blot in control (n=6) and chronic CXCL10 treated cultures (n=6 for each CXCL10 concentration; 50 nM, diagonal; 100 nM, white; 250 nM, black). The dashed lines represent control levels. Statistical significance (*), calculated by one group t-test, was set at p ≤ 0.05. (B,D). Representative Western blot of Bcl-2 (B) and SOD2 (D).
References
-
- Asensio VC, Campbell IL. Chemokines in the CNS: plurifunctional mediators in diverse states. Trends Neurosci. 1999;22:504–512. - PubMed
-
- Bahr BA, Bendiske J, Brown QB, Munirathinam S, Caba E, Rudin M, Urwyler S, Sauter A, Rogers G. Survival signaling and selective neuroprotection through glutamatergic transmission. Exp Neurol. 2002;174:37–47. - PubMed
-
- Bailey CH, Kaang BK, Chen M, Martin KC, Lim CS, Casadio A, Kandel ER. Mutation in the phosphorylation sites of MAP kinase blocks learning-related internalization of apCAM in Aplysia sensory neurons. Neuron. 1997;18:913–924. - PubMed
-
- Biber K, Sauter A, Brouwer N, Copray SC, Boddeke HW. Ischemia-induced neuronal expression of the microglia attracting chemokine Secondary Lymphoid-tissue Chemokine (SLC) Glia. 2001;34:121–133. - PubMed
Publication types
MeSH terms
Substances
Grants and funding
LinkOut - more resources
Full Text Sources
Miscellaneous
