

Searching for epistasis and linkage heterogeneity by correlations of pedigree-specific linkage scores
- PMID: 18330905
- PMCID: PMC2674316
- DOI: 10.1002/gepi.20319
Searching for epistasis and linkage heterogeneity by correlations of pedigree-specific linkage scores
Abstract
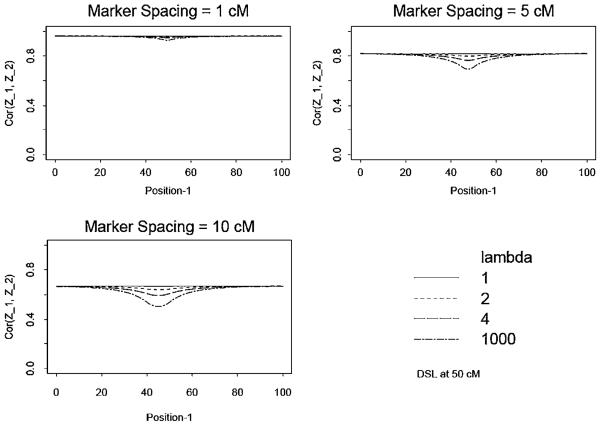
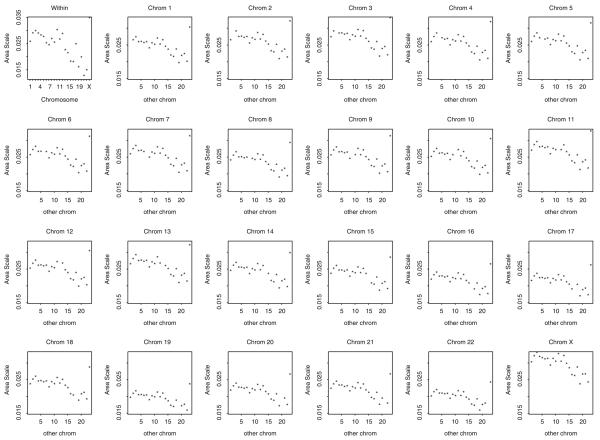
Recognizing that multiple genes are likely responsible for common complex traits, statistical methods are needed to rapidly screen for either interacting genes or locus heterogeneity in genetic linkage data. To achieve this, some investigators have proposed examining the correlation of pedigree linkage scores between pairs of chromosomal regions, because large positive correlations suggest interacting loci and large negative correlations suggest locus heterogeneity (Cox et al. [1999]; Maclean et al. [1993]). However, the statistical significance of these extreme correlations has been difficult to determine due to the autocorrelation of linkage scores along chromosomes. In this study, we provide novel solutions to this problem by using results from random field theory, combined with simulations to determine the null correlation for syntenic loci. Simulations illustrate that our new methods control the Type-I error rates, so that one can avoid the extremely conservative Bonferroni correction, as well as the extremely time-consuming permutational method to compute P-values for non-syntenic loci. Application of these methods to prostate cancer linkage studies illustrates interpretation of results and provides insights into the impact of marker information content on the resulting statistical correlations, and ultimately the asymptotic P-values.
(c) 2008 Wiley-Liss, Inc.
Figures
Similar articles
-
Affected relative pairs and simultaneous search for two-locus linkage in the presence of epistasis.Genet Epidemiol. 2007 Jul;31(5):431-49. doi: 10.1002/gepi.20223. Genet Epidemiol. 2007. PMID: 17410530
-
A new strategy for linkage analysis under epistasis taking into account genetic heterogeneity.Hum Hered. 2009;68(4):231-42. doi: 10.1159/000228921. Epub 2009 Jul 22. Hum Hered. 2009. PMID: 19622890
-
Regression models for linkage heterogeneity applied to familial prostate cancer.Am J Hum Genet. 2001 May;68(5):1189-96. doi: 10.1086/320102. Epub 2001 Apr 13. Am J Hum Genet. 2001. PMID: 11309684 Free PMC article.
-
Joint linkage of multiple loci for a complex disorder.Am J Hum Genet. 1993 Aug;53(2):353-66. Am J Hum Genet. 1993. PMID: 8328454 Free PMC article.
-
The sumLINK statistic for genetic linkage analysis in the presence of heterogeneity.Genet Epidemiol. 2009 Nov;33(7):628-36. doi: 10.1002/gepi.20414. Genet Epidemiol. 2009. PMID: 19217022 Free PMC article.
References
-
- Abecasis G, Cherny S, Cookson W, Cardon L. Merlin—rapid analysis of dense genetic maps using sparse gene flow trees. Nat Genet. 2002;30:97–101. - PubMed
-
- Adler R. The Geometry of Random Fields. Wiley; New York: 1976.
-
- Adler R, Hasofer A. Level crossings for random fields. Ann Prob. 1976;4:1–12.
-
- Bell JT, Wallace C, Dobson R, Wiltshire S, Mein C, Pembroke J, Brown M, Clayton D, Samani N, Dominiczak A, Webster J, Lathrop GM, Connell J, Munroe P, Caulfield M, Farrall M. Two-dimensional genome-scan identifies novel epistatic loci for essential hypertension. Hum Mol Genet. 2006;15:1365–1374. - PubMed
Publication types
MeSH terms
Grants and funding
- CA78836/CA/NCI NIH HHS/United States
- R01GM67768/GM/NIGMS NIH HHS/United States
- R01CA72818/CA/NCI NIH HHS/United States
- K05 CA090754/CA/NCI NIH HHS/United States
- R01 GM067768/GM/NIGMS NIH HHS/United States
- R01 CA072818/CA/NCI NIH HHS/United States
- ImNIH/Intramural NIH HHS/United States
- R01CA80122/CA/NCI NIH HHS/United States
- R01 CA080122/CA/NCI NIH HHS/United States
- CA90754/CA/NCI NIH HHS/United States
- R01 GM065450/GM/NIGMS NIH HHS/United States
- N01 CA015083/CA/NCI NIH HHS/United States
- R01 CA078836/CA/NCI NIH HHS/United States
- R01CA15083/CA/NCI NIH HHS/United States
LinkOut - more resources
Full Text Sources
