. 2008 Jun;57(6):1482-90.
doi: 10.2337/db07-1702. Epub 2008 Mar 10.

Central nervous system neuropeptide Y signaling modulates VLDL triglyceride secretion

Affiliations

Central nervous system neuropeptide Y signaling modulates VLDL triglyceride secretion

John M Stafford et al. Diabetes. 2008 Jun.

Abstract

Objective: Elevated triglyceride (TG) is the major plasma lipid abnormality in obese and diabetic patients and contributes to cardiovascular morbidity in these disorders. We sought to identify novel mechanisms leading to hypertriglyceridemia. Resistance to negative feedback signals from adipose tissue in key central nervous system (CNS) energy homeostatic circuits contributes to the development of obesity. Because triglycerides both represent the largest energy depot in the body and are elevated in both the plasma and adipose in obesity and diabetes, we hypothesized that the same neural circuits that regulate energy balance also regulate the secretion of TGs into plasma.

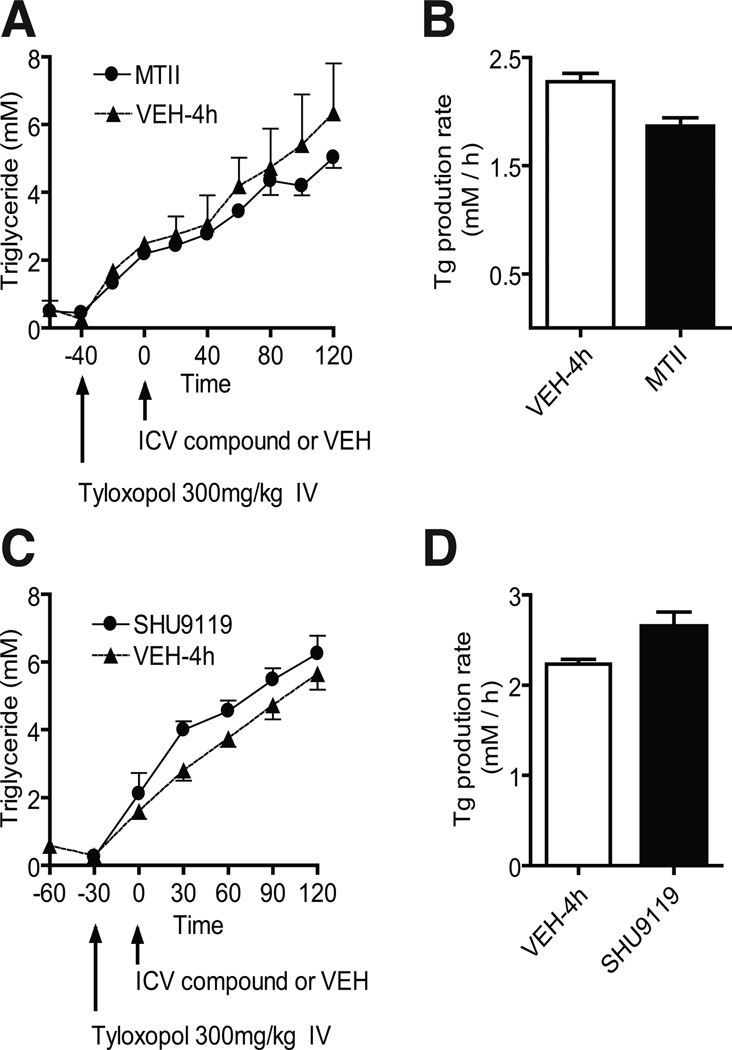
Research design and methods: In normal fasting rats, the TG secretion rate was estimated by serial blood sampling after intravascular tyloxapol pretreatment. Neuropeptide Y (NPY) signaling in the CNS was modulated by intracerebroventricular injection of NPY, receptor antagonist, and receptor agonist.

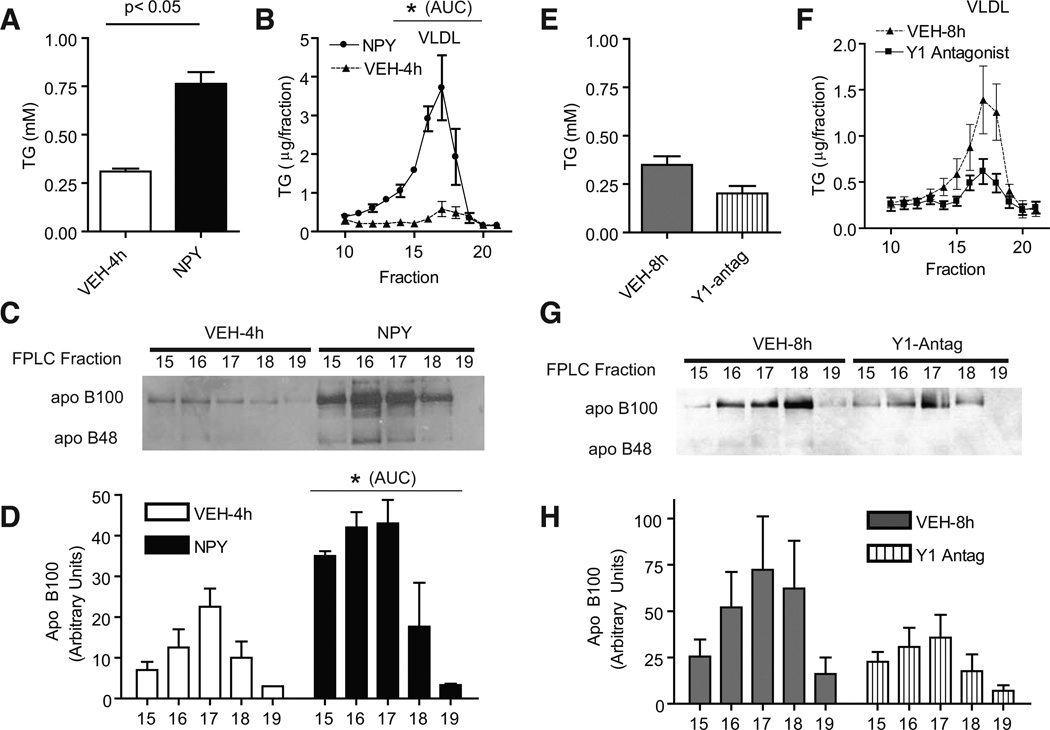
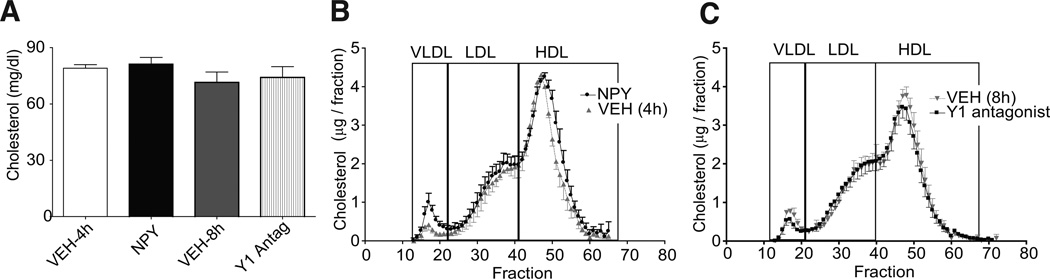
Results: A single intracerebroventricular injection of NPY increased TG secretion by 2.5-fold in the absence of food intake, and this was determined to be VLDL by fast performance liquid chromatography (FPLC). This effect was recapitulated by activating NPY signaling in downstream neurons with an NPY-Y5 receptor agonist. An NPY-Y1 receptor antagonist decreased the elevated TGs in the form of VLDL secretion rate by 50% compared with vehicle. Increased TG secretion was due to increased secretion of VLDL particles, rather than secretion of larger particles, because apolipoprotein B100 was elevated in FPLC fractions corresponding to VLDL.

Conclusions: We find that a key neuropeptide system involved in energy homeostasis in the CNS exerts control over VLDL-TG secretion into the bloodstream.


Figures

FIG. 1
FIG. 1
Intracerebroventricular NPY increases TG production. A: Plasma TG levels after an intra-arterial injection of tyloxapol (t-40) and either 1 nmol intracerebroventricular NPY injection (t = 0; circles) or saline vehicle (VEH)-4 h (triangles) are shown after a 4-h fast. B: Plasma TG levels after intra-arterial injection of tyloxapol (t-30) and intracerebroventricular injection at t = 0 of the Y5 receptor specific agonist (BWX-46, 30 µg; circles) or 4-h saline vehicle (triangles). C: Plasma TG levels after intracerebroventricular injection of Y1 receptor antagonist (1229U91, 30 µg; squares) or saline VEH-8 h (diamonds) are shown after an 8-h fast. D: Changes in TG production rate mediated by CNS NPY signaling calculated from the slope of the rise of the plasma TG line from time of tyloxapol injection. E: FPLC was performed from pooled serum samples of animals treated with tyloxapol and 2 h after intracerebroventricular treatment. Samples 14–18 contained VLDL. NPY, circles; VEH, triangles; Y1 receptor antagonist, squares. For all panels, *P < 0.05 and **P < 0.0001 compared with VEH.
FIG. 2
FIG. 2
CNS melanocortin signaling has little effect on TG production. A: Plasma TG levels after intra-arterial tyloxapol injection (t-40) in response to intracerebroventricular injection of MTII (1 nmol; circles), compared with vehicle (VEH) (triangles). B: Calculated TG production rate in response to MTII. C: Plasma TG levels after intra-arterial tyloxapol injection (t-30) in response to intracerebroventricular injection of SHU9119 (15 µg; circles) compared with VEH (triangles). D: Calculated TG production rate in response to SHU9119.
FIG. 3
FIG. 3
Effects of CNS NPY signaling on substrate availability, glucoregulatory hormones, and liver lipids in the absence of tyloxapol (n = 6 for all groups, all panels). For all panels, in the absence of tyloxapol, NPY (black bars) was given after a 4-h fast compared with vehicle (VEH) (4 h, open bars), Y1 receptor antagonist was given after a 8-h fast (striped bars) compared with VEH (8 h; gray bars), and samples were collected 2 h after intracerebroventricular injection. A: Body weights were matched between groups. B: Plasma FFA levels. C: Plasma insulin levels. D: Plasma glucagon levels. E: Plasma leptin levels. F: Hepatic apoB100 and apoB48 content. G: Hepatic TG and cholesterol content. H: MTP activity assayed from liver samples. I: Hepatic long-chain fatty acyl CoA content.
FIG. 4
FIG. 4
NPY enhances VLDL particle secretion. A–D: In the absence of tyloxapol, NPY (black bars) was given after a 4-h fast compared with vehicle (VEH) (4 h, open bars), and samples were collected 2 h after intracerebroventricular injection. A: Fasting plasma TG levels. B: TG content of FPLC fractions corresponding to VLDL, fractions 10–22 for NPY (circles) compared with VEH-4 h (triangles). *P < 0.05 for AUC. C: Western blot analysis of apoB100 and apoB48 from FPLC fractions corresponding to VLDL. D: Quantification of apoB100 from Western blot, *P < 0.05 for AUC. E–H: In the absence of tyloxapol, Y1 receptor antagonist given after an 8-h fast (striped bars) compared with VEH (8 h; gray bars), and samples were collected 2 h after intracerebroventricular injection. E: Fasting plasma TG levels. F: TG content of FPLC fractions corresponding to VLDL, fractions 10–22 for VEH-8 h (triangles) compared with Y1 antagonist (triangles). G: Western blot analysis of apoB100 and apoB48 from FPLC fractions corresponding to VLDL. H: Quantification of apoB100 from Western blot.
FIG. 5
FIG. 5
Effect of CNS NPY signaling on proteins involved in TG synthesis and metabolism. A: Western blot analysis from liver samples of six individual animals that were obtained 2 h after treatment with intracerebroventricular vehicle (VEH)-4 h (left lanes) or intracerebroventricular NPY (right lanes). Total ACC, phosphorylated-ACC, MTP, FAS, and β-actin as a loading control. Intracerebroventricular NPY did not alter expression levels of these proteins at 2 h. B–E: Real-time RT-PCR for MTP (B), ARF-1 (C), SCD-1 (D), and FAS (E). For all panels, *P < 0.05 compared with VEH.
FIG. 6
FIG. 6
Effect of NPY signaling on the cholesterol content of lipoprotein fractions determined by FPLC. For all panels, in the absence of tyloxapol, NPY was given after a 4-h fast compared with vehicle (VEH)-4 h, Y1 receptor antagonist was given after an 8-h fast compared with VEH 8 h, and samples were collected 2 h after intracerebroventricular injection. A: Total cholesterol (n = 6). B and C: Samples collected 2 h after intracerebroventricular injections were subject to FPLC. Data are means ± SE for cholesterol concentration, n = 3–6. B: NPY (black circles) compared with VEH-4 h (gray triangles). C: The Y1 receptor antagonist (black squares) compared with VEH-8 h (gray upside-down triangles).

References

    1. Chahil TJ, Ginsberg HN. Diabetic dyslipidemia. Endocrinol Metab Clin North Am. 2006;35:491–510. vii–viii. - PubMed
    1. Castelli WP, Garrison RJ, Wilson PW, Abbott RD, Kalousdian S, Kannel WB. Incidence of coronary heart disease and lipoprotein cholesterol levels: The Framingham Study. JAMA. 1986;256:2835–2838. - PubMed
    1. Fuller JH, Stevens LK, Wang SL. Risk factors for cardiovascular mortality and morbidity: the WHO Mutinational Study of Vascular Disease in Diabetes. Diabetologia. 2001;44(Suppl. 2):S54–S64. - PubMed
    1. Elovson J, Chatterton JE, Bell GT, Schumaker VN, Reuben MA, Puppione DL, Reeve JR, Jr, Young NL. Plasma very low density lipoproteins contain a single molecule of apolipoprotein B. J Lipid Res. 1988;29:1461–1473. - PubMed
    1. Pullinger CR, North JD, Teng BB, Rifici VA, Ronhild de Brito AE, Scott J. The apolipoprotein B gene is constitutively expressed in HepG2 cells: regulation of secretion by oleic acid, albumin, and insulin, and measurement of the mRNA half-life. J Lipid Res. 1989;30:1065–1077. - PubMed

Publication types

MeSH terms