. 2008 Mar 17;205(3):669-84.
doi: 10.1084/jem.20071135. Epub 2008 Mar 10.

A gammaherpesvirus-secreted activator of Vbeta4+ CD8+ T cells regulates chronic infection and immunopathology

Affiliations

A gammaherpesvirus-secreted activator of Vbeta4+ CD8+ T cells regulates chronic infection and immunopathology

Andrew G Evans et al. J Exp Med. .

Abstract

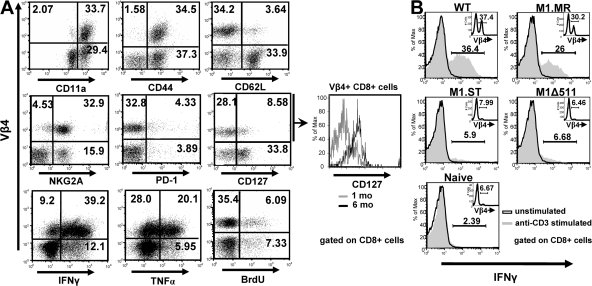
Little is known about herpesvirus modulation of T cell activation in latently infected individuals or the implications of such for chronic immune disorders. Murine gammaherpesvirus 68 (MHV68) elicits persistent activation of CD8(+) T cells bearing a Vbeta4(+) T cell receptor (TCR) by a completely unknown mechanism. We show that a novel MHV68 protein encoded by the M1 gene is responsible for Vbeta4(+) CD8(+) T cell stimulation in a manner reminiscent of a viral superantigen. During infection, M1 expression induces a Vbeta4(+) effector T cell response that resists functional exhaustion and appears to suppress virus reactivation from peritoneal cells by means of long-term interferon-gamma (IFNgamma) production. Mice lacking an IFNgamma receptor (IFNgammaR(-/-)) fail to control MHV68 replication, and Vbeta4(+) and CD8(+) T cell activation by M1 instead contributes to severe inflammation and multiorgan fibrotic disease. Thus, M1 manipulates the host CD8(+) T cell response in a manner that facilitates latent infection in an immunocompetent setting, but promotes disease during a dysregulated immune response. Identification of a viral pathogenecity determinant with superantigen-like activity for CD8(+) T cells broadens the known repertoire of viral immunomodulatory molecules, and its function illustrates the delicate balance achieved between persistent viruses and the host immune response.


Figures

Figure 1.
Figure 1.
M1 and the Vβ4+ CD8 T cell response are required for virus-induced inflammation and fibrosis in IFNγ-unresponsive mice. IFNγR−/− mice were infected with 103 PFU of the indicated virus intranasally and analyzed at 28 d after infection in A–D. (A) Hematoxylin and eosin staining of pathological changes in the spleen, liver, and lung. Bars: (spleen and liver) black, 200 μm; (spleen and liver) white, 80 μm; (lung) black, 400 μm; (lung) white, 40 μm. (B) Representative flow cytometric plots of Vβ4+ CD8+ T cell populations from mice infected with each virus. Numeric values are given for the proportion of CD8+ cells (right quadrants only). (C) Immunohistochemical staining for CD8+ cells and Vβ4+ cells in inflammatory lesions of the lung from M1.MR-infected animals, as indicated by brown chromogen deposition. Bars, 160 μm. (D) Persistent replication of each virus from each organ as measured by plaque assay. (E) Masson trichrome staining of lung sections at 180 d after infection from mice infected with 105 PFU of WT or M1Δ511 virus. Blue indicates areas of collagen deposition. Bars, 200 μm.
Figure 2.
Figure 2.
The M1 ORF is required for Vβ4+ CD8+ T cell expansion. (A) C57BL/6 mice were infected intranasally with 103 PFU of each viral genotype as indicated, and the Vβ4+ CD8+ splenocyte population was measured at 28 d after infection. Representative flow plots for five viral genotypes, as well as uninfected mice, are shown. Numeric values are given for the proportion of CD8+ cells (right hand quadrants) only. (B) Graphical representation of the Vβ4+ population size elicited by all viral genotypes, as described in part A, at the indicated times after infection. Data are pooled from 1–3 independent experiments with 3–5 mice per group. Error bars denote the SD. (C) Schematic diagram of the γHV68 genome highlighting the 9.5-kb region of interest with the genetic structure of mutants Δ9473 (16), M1Δ511 (15), M2.STOP (18), M3.STOP (22), and M4.STOP (17) shown in relation. The novel mutations that constitute the M1.STOP virus are underlined (five base pair substitutions yielding back-to-back translational stop codons, followed by a single deletion producing a downstream frameshift). Large and small triangles correspond to the eight viral tRNAs and nine viral microRNAs, respectively (44). (D) The Vβ repertoire of CD8+ splenocytes was examined 28 d after intranasal infection of a C57BL/6 mouse with 103 PFU of the indicated virus.
Figure 3.
Figure 3.
M1 function suppresses reactivation from latency in accordance with Vβ4+ CD8+ T cell activation. C57BL/6 mice were infected by intraperitoneal inoculation with 102 or 106 PFU of each indicated virus, and the extent of reactivation and latency among the PECs was quantified by limiting dilution analyses. Time points were chosen before, after, and long after the Vβ4+ CD8+ T cell expansion had occurred, at 16–18 (A), 42–44 (B), and 195–200 d (C) after infection, respectively. The frequency of reactivation was measured by plating live cells in a limiting dilution series onto a MEF indicator monolayer and scoring the frequency of wells positive for cytopathic effect (CPE; top). The relative contribution of preformed infectious virus was evaluated in parallel by mechanically disrupting the maximum number of cells and plating the cell lysates in parallel. In each of the experiments, the contribution of preformed virus accounted for ≤1% of the CPE produced by plating intact cells (not depicted). The frequency of latently infected, viral genome-positive cells was measured by subjecting a limiting dilution series of cells to lysis and proteinase K digestion, followed by highly sensitive nested PCR capable of detecting a single copy of the MHV68 genome (bottom). Graphs represent the combined data from three independent experiments with 4–5 animals per group. Error bars denote the SD.
Figure 4.
Figure 4.
M1 is incapable of regulating virus reactivation in the absence of robust Vβ4+ CD8+ T cell expansion among BALB/c mice. (A) BALB/c mice were infected intranasally with 103 PFU of the indicated viruses, and the proportion of Vβ4+ CD8+ splenocytes was quantified at the indicated times. Data are pooled from 1–2 independent experiments with 2–4 mice per group. (B) Representative flow plots of the Vβ4+ CD8+ T cell expansion at 28 d after infection from mice in A. Numeric values are given for the proportion of CD8+ cells (right quadrants) only. (C) Reactivation from BALB/c PECs was measured by limiting dilution assay from mice infected via intraperitoneal inoculation with 106 PFU of the indicated viral genotype either 42–44 or 130–132 d earlier. The experimental conditions and assays performed here are identical to the experiments performed on C57BL/6 mice in Fig. 3 B, with the exception of late time point being performed at ∼4 mo after infection. Red line and symbols, M1.Stop; black line and symbols, WT MHV68. Error bars denote the SD.
Figure 5.
Figure 5.
Vβ4+ CD8+ cells exhibit effector memory T cell characteristics, including potent IFNγ production during γHV68 latency. (A) CD8+ T cells were examined for multiple markers of T cell activation, proliferation, and effector function after intranasal infection of C57BL/6 mice with 103 PFU of WT MHV68. All plots are gated on total CD8+ splenocytes and are representative of multiple samples from independent experiments measured at 28 d after infection. Identical analyses were performed as late as 6 mo after infection, and the only significant change observed was the up-regulation of CD127 as shown in the offset panel (gray histogram, 1 mo after infection; black histogram, 6 mo after infection). Representative plots for ICC staining are shown from 2.5 mo after infection, at which time splenocytes were cultured in the presence of Brefeldin A and 1 μg/ml of soluble anti-CD3 monoclonal antibody to elicit cytokine production. BrdU incorporation was measured at 4 mo after infection after a 1-wk course of BrdU administration in the drinking water (0.8 mg/ml) of infected mice. Numeric values are given for the proportion of total CD8+ cells in each quadrant. (B) ICC staining for IFNγ production was performed as in A on CD8+ splenocytes from C57BL/6 mice at 28 d after infection with each indicated viral genotype. Insets show frequency of Vβ4+ cells from unstimulated controls for each sample. Plots are representative of results for 2–3 animals per condition.
Figure 6.
Figure 6.
The M1 ORF encodes a 45-kD secreted protein that is capable of stimulating MHV68-induced Vβ4+ CD8+ T cells. (A) Cos-1 cells were transiently transfected with M1 and M3 expression constructs containing C-terminal FLAG epitopes. Whole-cell lysates and cell supernatants were immunoprecipitated and detected with anti-FLAG antibody. (B) Schematic diagram of experimental design for T cell stimulation. Supernatants from Cos-1–transfected cells containing M1 and M3 recombinant protein were compared with complete media with and without 1 μg/ml anti-CD3, all supplemented with Brefeldin A, for the ability to stimulate primary Vβ4+ CD8+ T cells from infected C57BL/6 mice as determined by ICC staining for IFNγ. (C) IFNγ production elicited by the indicated stimuli from CD8+ splenocytes at 4–6 mo after infection. Note that the extent of background IFNγ production among unstimulated Vβ4+ CD8+ T cells exhibited mouse-to-mouse variation, but was repeatedly higher then Vβ4 cells and was most readily detected at a 1:100 dilution of Brefeldin A (GolgiPlug). Numeric values are given for the proportion of Vβ4+ CD8+ cells (right quadrants) only. (D) IFNγ production elicited by the indicated stimuli from CD8+ splenocytes at 12 d and 2 mo after infection. Numeric values for the proportion of Vβ4+ cells (right quadrants only) are given for the 2-mo time point in larger font, and the total proportion of CD8+ cells in each quadrant are given for both time points in parentheses. (E) IFNγ production elicited by the indicated stimuli from CD8+ PECs at 2 mo after infection. Numeric values are reported as in D. In all panels, plots are representative of two or more independent experiments, each containing 2–3 mice.
Figure 7.
Figure 7.
Vβ4+ TCR stimulation by M1 requires intact protein and is independent of professional antigen presentation. (A) Histograms quantifying the percentage of Vβ4+ CD8+ splenocytes that produce IFNγ under the indicated condition. M1-containing supernatants were modified in the following manner. Depleted and nondepleted supernatants were immunoprecipitated using anti-FLAG- and IgG-conjugated agarose, respectively. Thrombin-conjugated agarose was used to protease digest recombinant M1, and then enzyme was removed by precipitation and inactivated with protease inhibitors. M1 contains a single predicted thrombin cleavage domain approximately midway through the primary sequence. M1 denaturation was the result of a 10-min incubation at 94°C. Asterisks indicate significantly different values for representative columns (P < 0.05). (B) Vβ4+ CD8+ hybridoma (4BH62) was cultured in isolation from any other cells for 36 h in the presence of M1- and M3-containing supernatants or conditioned supernatants from Cos-1 cells both with and without 1 μg/ml anti-CD3. Cells were fixed, stained with X-gal for LacZ expression, and photographed under an inverted microscope. Bars, 80 μm. (C) ELISA measurements for the concentration of IL-2 in the culture supernatant of each hybridoma line after 36 h stimulation under the indicated conditions, as in part B. The limit of detection is 2 pg/ml. As a control, all supernatants were tested and found below the limit of detection before being used to culture hybridoma lines (not depicted). Error bars denote the SD.
Figure 8.
Figure 8.
Model for M1 antigen–mediated control of virus reactivation, and association of M1 antigen with the induction of fibrotic disease in IFNγ-unresponsive mice. (A) Infection of WT C57BL/6 mice elicits a strong Vβ4+ CD8+ T cell response via stimulation by soluble M1. Subsequent virus reactivation events lead to limited Vβ4+ CD8+ T cell activation, IFNγ production, and the suppression of virus reactivation from specific latently infected cell populations (i.e., macrophages). (B) MHV68 infection in IFNγR−/− mice leads to virus reactivation and persistent virus replication. In this scenario, the failure of infected cells to respond to IFNγ-mediated suppression of virus reactivation leads to hyperactivation of the expanded Vβ4+ CD8+ T cell population, resulting in tissue damage by an unknown mechanism (see Discussion). (C) Infection of IFNγ-unresponsive mice with M1-null MHV68 fails to elicit expansion or activation of Vβ4+ CD8+ T cells, and no tissue damage is observed in this setting, even though there is ongoing virus reactivation and replication, as shown in Fig. 1 D.

Similar articles

Cited by

References

    1. Knipe, D.M., P.M. Howley, D.E. Griffin, R.A. Lamb, S.E. Straus, M.A. Martin, and B. Roizman, editors. 2007. Fields Virology. Lippincott Williams and Wilkins, Philadelphia.
    1. Virgin, H.W., P. Latreille, P. Wamsley, K. Hallsworth, K.E. Weck, A.J. Dal Canto, and S.H. Speck. 1997. Complete sequence and genomic analysis of murine gammaherpesvirus 68. J. Virol. 71:5894–5904. - PMC - PubMed
    1. McGeoch, D.J., D. Gatherer, and A. Dolan. 2005. On phylogenetic relationships among major lineages of the Gammaherpesvirinae. J. Gen. Virol. 86:307–316. - PubMed
    1. Speck, S.H., and H.W. Virgin. 1999. Host and viral genetics of chronic infection: a mouse model of gamma-herpesvirus pathogenesis. Curr. Opin. Microbiol. 2:403–409. - PubMed
    1. Virgin, H.W., and S.H. Speck. 1999. Unraveling immunity to gamma-herpesviruses: a new model for understanding the role of immunity in chronic virus infection. Curr. Opin. Immunol. 11:371–379. - PubMed

Publication types

MeSH terms

Associated data