. 2008 Mar 10;180(5):957-71.
doi: 10.1083/jcb.200708048.

Calpain 2 and PTP1B function in a novel pathway with Src to regulate invadopodia dynamics and breast cancer cell invasion

Affiliations

Calpain 2 and PTP1B function in a novel pathway with Src to regulate invadopodia dynamics and breast cancer cell invasion

Christa L Cortesio et al. J Cell Biol. .

Abstract

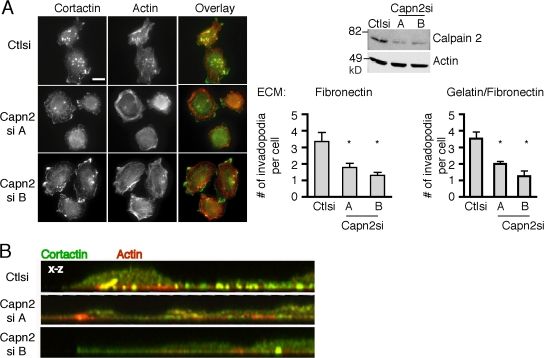
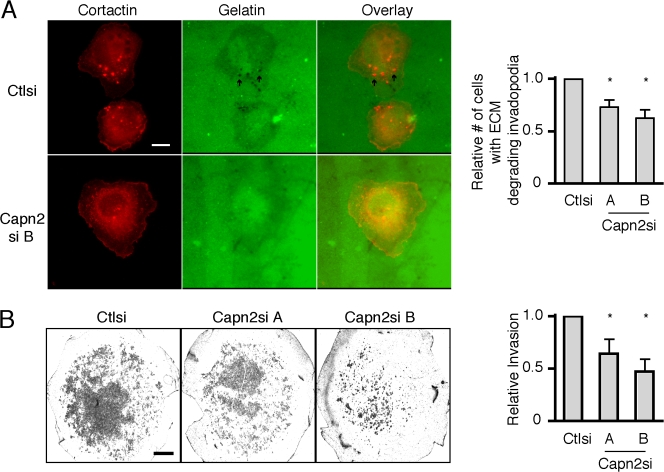
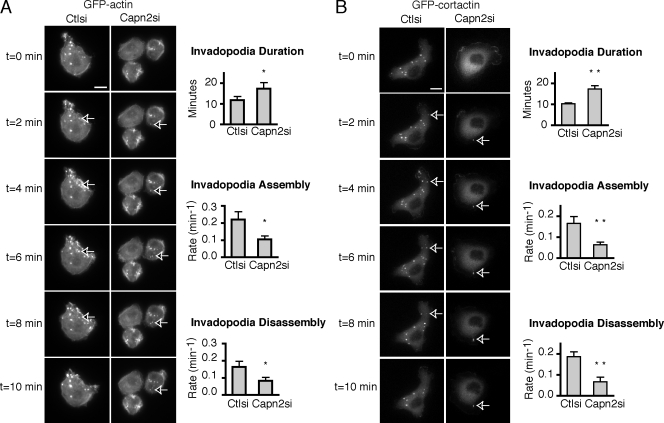
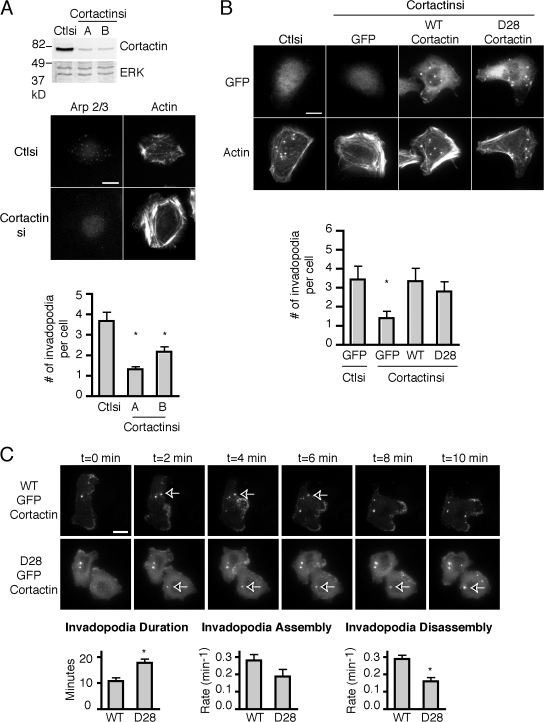
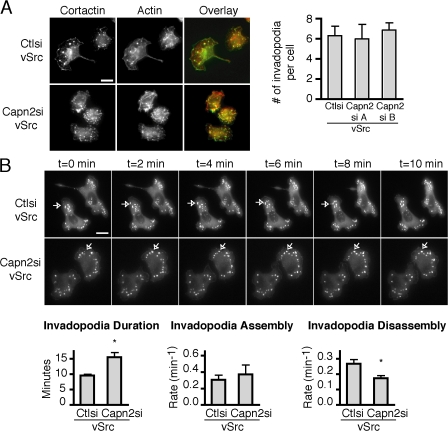
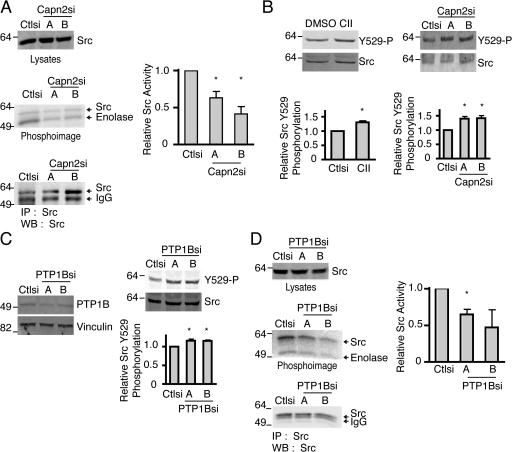
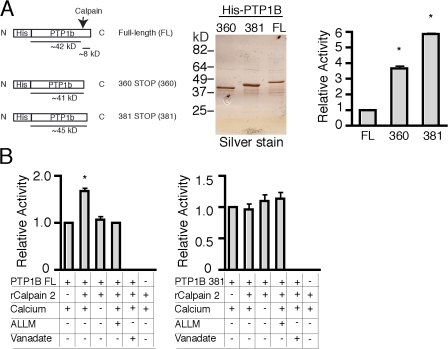
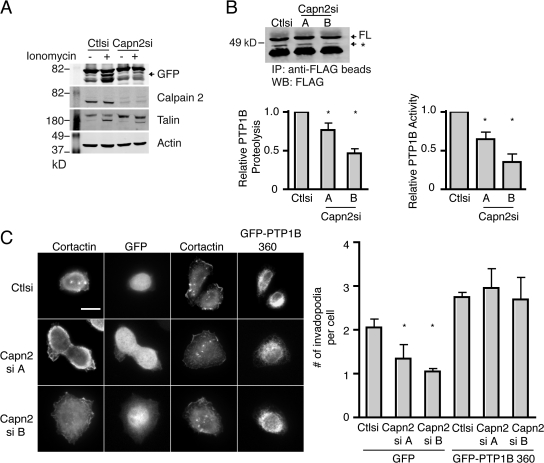
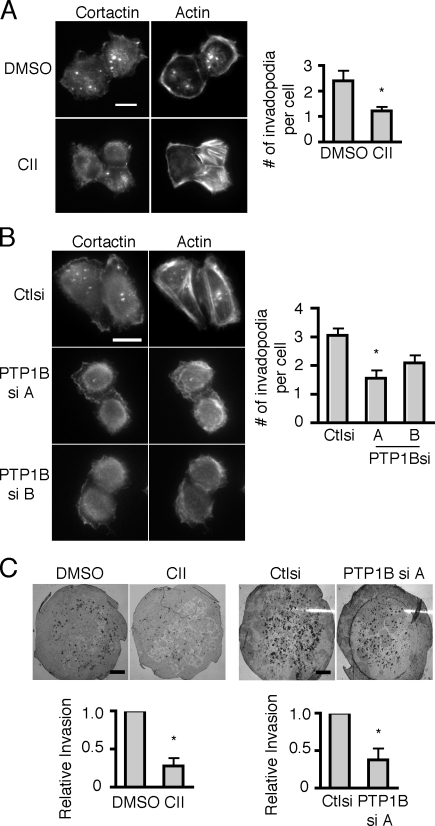
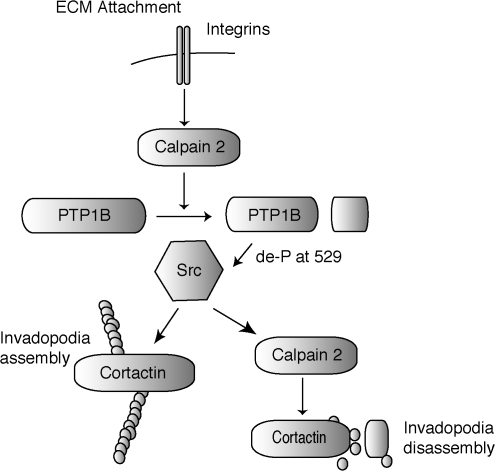
Invasive cancer cells form dynamic adhesive structures associated with matrix degradation called invadopodia. Calpain 2 is a calcium-dependent intracellular protease that regulates adhesion turnover and disassembly through the targeting of specific substrates such as talin. Here, we describe a novel function for calpain 2 in the formation of invadopodia and in the invasive abilities of breast cancer cells through the modulation of endogenous c-Src activity. Calpain-deficient breast cancer cells show impaired invadopodia formation that is rescued by expression of a truncated fragment of protein tyrosine phosphatase 1B (PTP1B) corresponding to the calpain proteolytic fragment, which indicates that calpain modulates invadopodia through PTP1B. Moreover, PTP1B activity is required for efficient invadopodia formation and breast cancer invasion, which suggests that PTP1B may modulate breast cancer progression through its effects on invadopodia. Collectively, our experiments implicate a novel signaling pathway involving calpain 2, PTP1B, and Src in the regulation of invadopodia and breast cancer invasion.


Figures

Figure 1.
Figure 1.
Calpain is necessary for invadopodia formation. (A) Cell lysates from MTLn3 cells stably expressing control or calpain 2 siRNA were analyzed by Western blotting and probed for calpain 2 and actin as a loading control. MTLn3 cells expressing control or calpain 2si (targets A and B) were cultured on FN-coated glass coverslips and stained with anti-cortactin antibody (green) and rhodamine phalloidin (red). Quantification of cortactin and actin containing invadopodia is expressed as the mean number of invadopodia per cell for FN-coated and gelatin/FN-coated coverslips. Data are mean ± SEM of three independent experiments. *, P < 0.05 compared with control cells. Bar, 10 μm. (B) Confocal images demonstrate actin (red) and cortactin (green) staining at protrusive structures on the ventral cell surface of control or calpain 2 si cells.
Figure 2.
Figure 2.
Calpain 2 is required for ECM degradation and invasion. (A) MTLn3 cells expressing control or calpain 2 siRNA were cultured on Oregon green 488 gelatin–coated coverslips and stained with anti-cortactin antibody. Arrows indicate areas of degradation that colocalize with cortactin containing invadopodia. Quantification of the percentage of cells containing any ECM-degrading invadopodia is shown. Data are mean ± SEM of three independent experiments. *, P < 0.02 compared with control cells. (B) MTLn3 cells expressing control or calpain 2si were plated on Matrigel-coated membranes and assayed for their ability to invade through the membrane. Invasion is shown relative to control cells. Data are mean ± SEM of three independent experiments. *, P < 0.04 compared with control cells. Bars: (A) 10 μm; (B) 1mm.
Figure 3.
Figure 3.
Invadopodia assembly and disassembly rates are reduced in calpain 2–deficient MTLn3 cells. (A) GFP-actin or (B) GFP-cortactin were transiently transfected into MTLn3 control and calpain 2 siRNA lines. Cells were plated on FN-coated glass-bottomed dishes and analyzed by time-lapse fluorescence microscopy. The time-lapse montage of calpain-deficient cells expressing GFP-actin (A) or GFP-cortactin (B) demonstrates that GFP-actin or GFP-cortactin persist at invadopodia for longer durations in calpain-deficient MTLn3 cells. Arrows indicate representative invadopodia. Duration measurements and assembly and disassembly rates are shown. Data show means ± SEM from four independent experiments. Asterisks indicate statistical significance compared with control based on a t test (*, P < 0.03; **, P < 0.05). See Videos 1–4 (available at http://www.jcb.org/cgi/content/full/jcb.200708048/DC1). Bars, 10 μm.
Figure 4.
Figure 4.
Calpain 2–mediated proteolysis of cortactin is not necessary for invadopodia formation but mediates disassembly of cortactin from invadopodia. (A) Cell lysates from MTLn3 cells stably expressing control or cortactin siRNA were analyzed by Western blotting and probed for cortactin and ERK as a loading control. MTLn3 cells expressing control or cortactin siRNA were cultured on gelatin/FN-coated coverslips and stained with anti–p34-Arc antibody and rhodamine phalloidin. Quantification of invadopodia is expressed as the mean number of invadopodia per cell. *, P < 0.05 compared with control cells. (B) Wild-type (WT) or calpain-resistant (D28) GFP-cortactin was transiently transfected into MTLn3 control and cortactin siRNA lines, cultured on gelatin/FN-coated coverslips, and stained with rhodamine phalloidin. Quantification of invadopodia is expressed as the mean number of invadopodia per cell. *, P < 0.05 compared with control cells. (C) GFP-cortactin WT or GFP-cortactin D28 expressing cells were plated on FN-coated glass-bottomed dishes and analyzed by time-lapse microscopy. Time-lapse montage of cortactin-deficient MTLn3 cells expressing GFP-cortactin WT or GFP-cortactin D28 demonstrates that GFP-cortactin D28 persists at invadopodia for longer durations than GFP-cortactin WT. Duration measurements and assembly and disassembly rates are shown. Arrows indicate representative invadopodia. Asterisk indicates statistical significance based on t test (P < 0.01). See Videos 5 and 6 (available at http://www.jcb.org/cgi/content/full/jcb.200708048/DC1). Data are means ± SEM from three independent experiments. Bars, 10 μm.
Figure 5.
Figure 5.
Calpain 2 regulates invadopodia dynamics downstream of transforming v-Src kinase in MTLn3 breast cancer cells. (A) Control and calpain 2 knockdown MTLn3 cells expressing v-Src kinase were cultured on FN-coated glass coverslips and stained with anti-cortactin antibody and rhodamine phalloidin. Quantification of cortactin and actin containing invadopodia is expressed as the mean number of invadopodia per cell. Data shown are means ± SEM of three independent experiments. (B) GFP-cortactin was transfected into v-Src transformed MTLn3 control or calpain 2 siRNA lines. Cells were plated on FN-coated glass-bottomed dishes and analyzed by time-lapse fluorescence microscopy. Fluorescent images of v-Src transformed control or calpain 2–deficient cells demonstrate that GFP-cortactin persists at invadopodia for longer durations in the absence of calpain 2. Arrows indicate representative GFP-cortactin containing invadopodia. Duration measurements and assembly and disassembly rates ± SEM are shown. Asterisks indicate statistical significance compared with control cells based on t test (P < 0.05). See Videos 7 and 8 (available at http://www.jcb.org/cgi/content/full/jcb.200708048/DC1). Bars, 10 μm.
Figure 6.
Figure 6.
Calpain 2 and PTP1B regulate Src kinase activity and phosphorylation on tyrosine 529 in MTLn3 breast cancer cells. (A) Lysates from MTLn3 cells expressing control or calpain 2 siRNA were probed for total Src expression. Immunoprecipitations were performed on lysates from MTLn3 cells stably expressing control or calpain 2 siRNA using Src-specific antibodies. Kinase activity assays were performed and the autoradiograph is shown. Quantification of Src activity relative to total Src in either control or calpain 2si lysates from three separate experiments ± SEM is shown. Asterisks indicate statistical significance compared with control based on t test (P < 0.01). (B) MTLn3 cells stably expressing control or calpain 2 siRNA were analyzed by immunoblotting and probed for total Src and phospho-Y529. As a positive control, wild-type MTLn3 cells were treated with 200 nM CII, a cell-permeable PTP1B inhibitor, or vehicle before lysis. Quantification of phospho-Y529 levels normalized to total Src ± SEM of three independent experiments is shown. Asterisks indicate statistical significance compared with control based on one-way ANOVA (P < 0.05). (C) Cell lysates from MTLn3 cells stably expressing control or PTP1B siRNA were analyzed by Western blotting and probed for calpain 2 and vinculin as a loading control. PTP1Bsi cell lysates were analyzed by immunoblot and probed for total Src and phospho-Y529. Quantification of phospho-Y529 levels normalized to total Src ± SEM of three independent experiments is shown. Asterisks indicate statistical significance compared with control based on one-way ANOVA (P < 0.05). (D) Src expression was analyzed by Western blotting in control and PTP1Bsi cells. Immunoprecipitations were performed as described in A on PTP1Bsi cells. Kinase activity assays were performed and the autoradiograph is shown. Quantification of Src activity relative to total Src in either control or PTP1Bsi lysate from three separate experiments is shown as the means ± SEM. The asterisk indicates statistical significance compared with control based on a t test (P < 0.05). Numbers to the left of gel blots indicate molecular mass standards in kD.
Figure 7.
Figure 7.
Calpain 2 proteolysis of PTP1B results in enhanced PTP1B activity. (A) Schematic of full-length and truncated His-tagged PTP1B constructs. The arrow indicates the approximate site of calpain 2 cleavage. Equal amounts of purified PTP1B constructs were assayed for phosphatase activity against pNPP as described in Materials and methods. Activity of truncated PTP1B constructs is expressed relative to the full-length protein. Activity data are shown as the means ± SEM from three separate experiments. Asterisks indicate statistical significance compared with full-length PTP1B activity based on a t test (P < 0.0001). (B) Purified full-length (FL) or PTP1B truncated at amino acid 381 were incubated in the presence or absence of purified calpain 2 and assayed for phosphatase activity. The asterisk indicates statistical significance compared with untreated PTP1B activity based on a t test (P < 0.001). Error bars represent the SEM of at least three different determinations.
Figure 8.
Figure 8.
Calpain 2 regulates PTP1B activity in vivo. (A) HEK cells transfected with GFP-PTP1B-HA were analyzed by Western blot after treatment with vehicle or ionomycin to stimulate calpain activity and blotted for GFP, calpain 2, talin, and actin as a loading control. Blots shown are representative of three independent experiments. The arrow indicates a calpain 2–dependent PTP1B cleavage product. (B) FLAG-PTP1B was transiently transfected into MTLn3 control and calpain 2 siRNA lines. Immunoprecipitations were performed on cells expressing FLAG-PTP1B after treatment with ionomycin. Shown are the relative amounts of FLAG-PTP1B that were pulled down. The arrow with an asterisk indicates a calpain 2–dependent PTP1B cleavage product. Blots shown are representative of three independent experiments. PTP1B cleavage was quantified for control and calpain 2 siRNA lines as a percentage of total FLAG-PTP1B expression and is shown relative to control cells. (left) Asterisks indicate statistical significance compared with control cells based on one-way ANOVA (P < 0.05). Immunoprecipitations were assayed for phosphatase activity against pNPP as described in Materials and methods. Activity of immunoprecipitated PTP1B constructs in MTLn3 calpain 2 siRNA lines is expressed relative to the control cell line. Activity data are shown as the means ± SEM from three separate experiments. (right) Asterisks indicate statistical significance based on a t test (P < 0.002). (C) MTLn3 cells were transfected with GFP-PTP1B truncated at amino acid 360 or GFP alone. Transfected cells were plated on FN-coated glass coverslips and stained with anti-cortactin antibody. Invadopodia formation was quantified by determining the mean number of invadopodia per cell. Data represent means ± SEM from three independent experiments. *, P < 0.05 compared with GFP-expressing control cells. Bar, 10 μm.
Figure 9.
Figure 9.
PTP1B is necessary for efficient invadopodia formation and invasion. (A) MTLn3 cells cultured on FN-coated glass coverslips were stained with anti-cortactin antibody and rhodamine phalloidin. Cells were cultured in the presence of vehicle or the cell-permeable PTP1B inhibitor CII. Quantification of invadopodia is expressed as the mean number of invadopodia per cell. Data are mean ± SEM of three independent experiments. *, P < 0.01 compared with control cells. (B) MTLn3 cells expressing control or PTP1Bsi were cultured on FN-coated glass coverslips and stained with anti-cortactin antibody and rhodamine phalloidin. Quantification of invadopodia is expressed as the mean number of invadopodia per cell. Data are mean ± SEM of three independent experiments. *, P < 0.01 compared with control cells. (C, left) MTLn3 cells were cultured in the presence of vehicle or CII and assayed for their ability to invade through the membrane. Invasion is shown relative to control cells. Data are mean ± SEM of three independent experiments. *, P < 0.05. (right) MTLn3 cells expressing control or PTP1B siRNA were plated on Matrigel-coated membranes and assayed for their ability to invade through the membrane. Invasion is shown relative to control cells. Data are mean ± SEM of three independent experiments. *, P < 0.02 compared with control cells. Bars: (A and B) 10 μm; (C) 1 mm.
Figure 10.
Figure 10.
Model for calpain 2 involvement in invadopodia dynamics. Integrin engagement and/or EGF receptor activation enhances calpain activity. Calpain cleaves PTP1B, resulting in enhanced phosphatase activity. PTP1B removes the inhibitory phosphate from Y529 of Src, thereby activating Src kinase activity and initiating invadopodia formation. Calpain 2 also functions downstream of Src kinase activity by regulating the disassembly of cortactin from invadopodia.

References

    1. Arregui, C.O., J. Balsamo, and J. Lilien. 1998. Impaired integrin-mediated adhesion and signaling in fibroblasts expressing a dominant-negative mutant PTP1B. J. Cell Biol. 143:861–873. - PMC - PubMed
    1. Artym, V.V., Y. Zhang, F. Seillier-Moiseiwitsch, K.M. Yamada, and S.C. Mueller. 2006. Dynamic interactions of cortactin and membrane type 1 matrix metalloproteinase at invadopodia: defining the stages of invadopodia formation and function. Cancer Res. 66:3034–3043. - PubMed
    1. Bentires-Alj, M., and B.G. Neel. 2007. Protein-tyrosine phosphatase 1B is required for HER2/Neu-induced breast cancer. Cancer Res. 67:2420–2424. - PubMed
    1. Bhatt, A.K., and A. Huttenlocher. 2003. Dynamic imaging of cell-substrate contacts. Methods Enzymol. 361:337–352. - PubMed
    1. Bjorge, J.D., A. Pang, and D.J. Fujita. 2000. Identification of protein-tyrosine phosphatase 1B as the major tyrosine phosphatase activity capable of dephosphorylating and activating c-Src in several human breast cancer cell lines. J. Biol. Chem. 275:41439–41446. - PubMed

Publication types

MeSH terms