. 2008 Mar 11:9:147.
doi: 10.1186/1471-2105-9-147.

Conditional clustering of temporal expression profiles

Affiliations

Conditional clustering of temporal expression profiles

Ling Wang et al. BMC Bioinformatics. .

Abstract

Background: Many microarray experiments produce temporal profiles in different biological conditions but common cluster techniques are not able to analyze the data conditional on the biological conditions.

Results: This article presents a novel technique to cluster data from time course microarray experiments performed across several experimental conditions. Our algorithm uses polynomial models to describe the gene expression patterns over time, a full Bayesian approach with proper conjugate priors to make the algorithm invariant to linear transformations, and an iterative procedure to identify genes that have a common temporal expression profile across two or more experimental conditions, and genes that have a unique temporal profile in a specific condition.

Conclusion: We use simulated data to evaluate the effectiveness of this new algorithm in finding the correct number of clusters and in identifying genes with common and unique profiles. We also use the algorithm to characterize the response of human T cells to stimulations of antigen-receptor signaling gene expression temporal profiles measured in six different biological conditions and we identify common and unique genes. These studies suggest that the methodology proposed here is useful in identifying and distinguishing uniquely stimulated genes from commonly stimulated genes in response to variable stimuli. Software for using this clustering method is available from the project home page.


Figures

Figure 1
Figure 1
Example of our approach to cluster temporal expression profiles measured in 3 biological conditions E1, E2 and E3. Cluster 1 comprises the expression profiles of genes 1 and 2 under the experimental condition E1. Cluster 2 comprises the expression profiles of gene 3 in both experimental conditions E1 and E2, and the expression profile of gene 1 in the experimental condition E2. Cluster 3 comprises the expression profile of gene 1 in the experimental condition E3, and the expression profiles of gene 2 in both experimental conditions E2 and E3. Cluster 4 comprises the expression profiles of gene 4 in all three experimental conditions E1, E2 and E3. The first gene has a unique expression profile in each experimental condition, so this gene reacts specifically (uniquely). Gene 2 has a unique profile in the third experimental condition and common profiles in both experimental conditions E1 and E2. Gene 4 has common profiles in all experimental conditions.
Figure 2
Figure 2
Flow chart for the two-step procedure for finding GUP and GCP. Here 'clustering' means performing the cluster analysis method we proposed here, and 'merging' means trying to merge the clusters from the previous step using the cluster analysis method we proposed here.
Figure 3
Figure 3
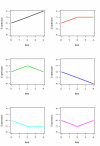
The six baseline patterns used to generate the data in the first two simulation studies.
Figure 4
Figure 4
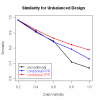
Similarity of the clusters found by the conditional clustering algorithm compared to the true cluster assignments. The figure on the left shows Rand statistic as a function of the variance (variable "var") and sample size (variable "ss"), when the clustering was done conditionally on a covariate that is not associated with the temporal patterns. The figure on the right shows Rand statistic when the clustering was conducted conditionally on a covariate that is associated with the temporal patterns. Large values of the statistic show a large agreement with the model used to generate the data.
Figure 5
Figure 5
Heatmaps displaying the difference of Rand statistic between conditional and unconditional clustering in the first set of simulations. Green cells denote negative values and hence conditional clustering produces clusters with lower accuracy compared to unconditional clustering. Red cells denote positive values and hence conditional clustering produces clusters with higher accuracy compared to unconditional clustering. Black cells show no difference. The intensity of the color shows the magnitude of the number as shown by the legend. The horizontal axis represents the number of simulated patters per cluster, and the vertical axis represents the variance.
Figure 6
Figure 6
Similarities of the clusters generated by the conditional clustering algorithm with the true cluster assignments in the second set of simulations.
Figure 7
Figure 7
Patterns used to generate data in the third simulation, and assignment to one of the two conditions. Red patterns are those of the GUP, and the blue patterns are those of the GCP. Labels on the right of the table show the magnitude of the patterns.
Figure 8
Figure 8
Simulation 3: The seven clusters resulting from the initial clustering of the simulated data before finding GCP and GUP. Black series are expressions in condition 1. Red series are expressions in condition 2. Note that we allow the ranges of the y-axis differ for different clusters for better reflection of the cluster shapes.
Figure 9
Figure 9
The five clusters related to CD3/CD28, PHA and PMA/lo.
Figure 10
Figure 10
Schematic.
Figure 11
Figure 11
Discovery of more subtle patterns with iterative procedure. Red: expression of genes after stimulation of CD3; Pink: expression of genes after stimulation of PMA/lo; Blue: expression of genes after stimulation of PHA.

References

    1. Alter O, Brown PO, Botstein D. Singular value decomposition for genome-wide expression data processing and modeling. Proc Natl Acad Sci USA. 2000;97:10101–10106. doi: 10.1073/pnas.97.18.10101. - DOI - PMC - PubMed
    1. Butte AJ, Tamayo P, Slonim D, Golub TR, Kohane IS. Discovering functional relationships between rna expression and chemotherapeutic susceptibility using relevance networks. Proc Natl Acad Sci USA. 2000;97:12182–12186. doi: 10.1073/pnas.220392197. - DOI - PMC - PubMed
    1. Eisen M, Spellman P, Brown P, Botstein D. Cluster analysis and display of genome-wide expression patterns. Proc Natl Acad Sci USA. 1998;95:14863–14868. doi: 10.1073/pnas.95.25.14863. - DOI - PMC - PubMed
    1. Tamayo P, Slonim D, Mesirov J, Zhu Q, Kitareewan S, Dmitrovsky E, Lander ES, Golub TR. Interpreting patterns of gene expression with self-organizing maps: Methods and application to hematopoietic differentiation. Proc Natl Acad Sci USA. 1999;96:2907–2912. doi: 10.1073/pnas.96.6.2907. - DOI - PMC - PubMed
    1. Golub R, Slonim DK, Tamayo P, Huard C, Gaasenbeek M, Mesirov JP, Loh ML, Coller H, Downing JR, Caligiuri MA, Bloomfield CD, Lander ES. Molecular classification of cancer: Class discovery and class prediction by gene expression monitoring. Science. 1999;286:531–537. doi: 10.1126/science.286.5439.531. - DOI - PubMed

Publication types

MeSH terms

LinkOut - more resources