. 2008 Mar;16(3):422-31.
doi: 10.1016/j.str.2008.01.005.

Regulation of neurexin 1beta tertiary structure and ligand binding through alternative splicing

Affiliations

Regulation of neurexin 1beta tertiary structure and ligand binding through alternative splicing

Kaiser C Shen et al. Structure. 2008 Mar.

Abstract

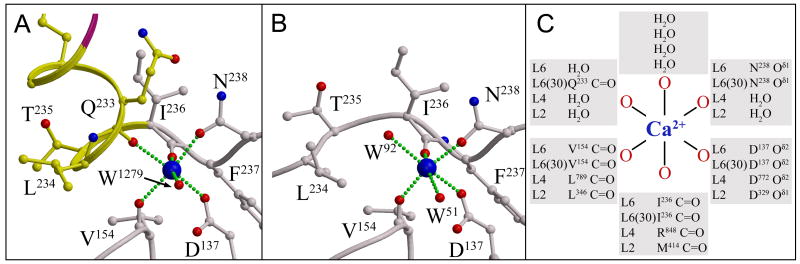
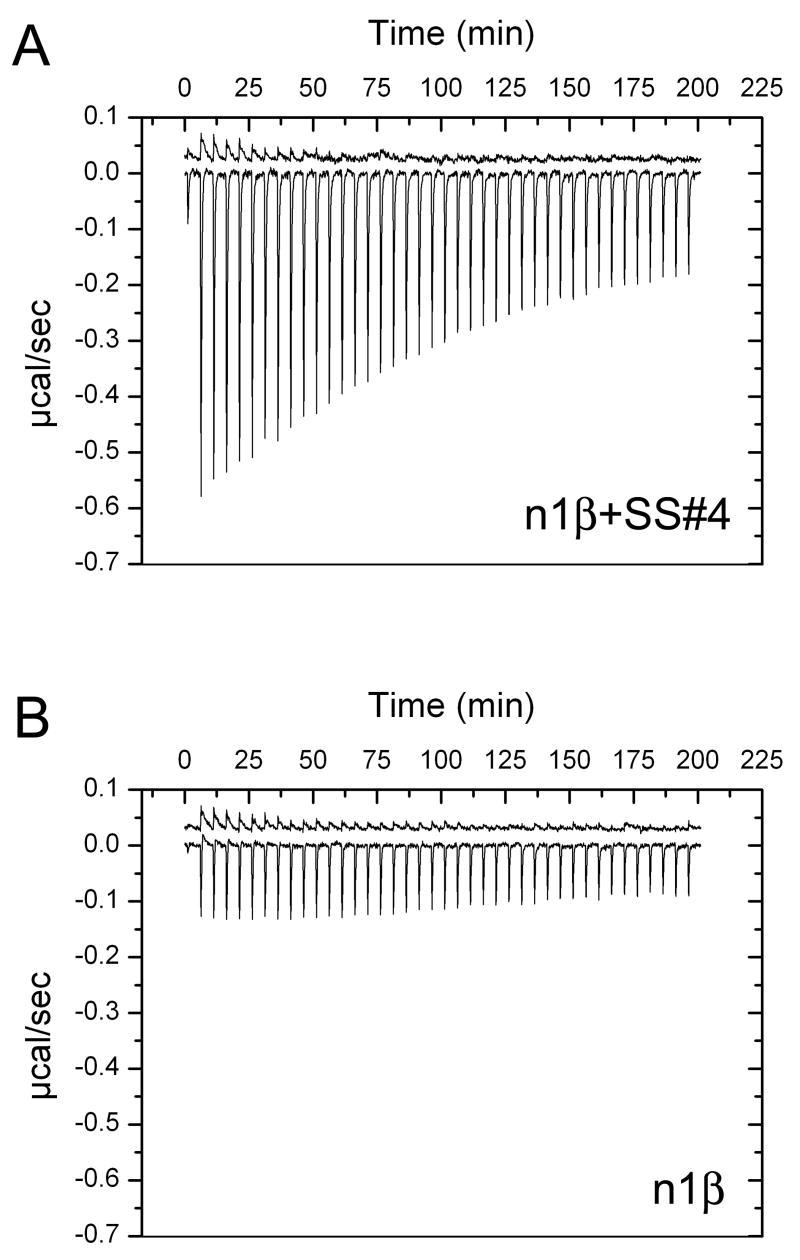
Neurexins and neuroligins play an essential role in synapse function, and their alterations are linked to autistic spectrum disorder. Interactions between neurexins and neuroligins regulate inhibitory and excitatory synaptogenesis in vitro through a "splice-insert signaling code." In particular, neurexin 1beta carrying an alternative splice insert at site SS#4 interacts with neuroligin 2 (found predominantly at inhibitory synapses) but much less so with other neuroligins (those carrying an insert at site B and prevalent at excitatory synapses). The structure of neurexin 1beta+SS#4 reveals dramatic rearrangements to the "hypervariable surface," the binding site for neuroligins. The splice insert protrudes as a long helix into space, triggers conversion of loop beta10-beta11 into a helix rearranging the binding site for neuroligins, and rearranges the Ca(2+)-binding site required for ligand binding, increasing its affinity. Our structures reveal the mechanism by which neurexin 1beta isoforms acquire neuroligin splice isoform selectivity.


Figures

Figure 1
Figure 1
a) Extracellular domain of neurexin 1α (n1α) and neurexin 1β (n1β). LNS/LG domains (abbreviated from Laminin, Neurexin, Sex hormone binding globulin/Laminin G domain) are indicated as grey squares labeled ‘L1’ through ‘L6’, or in the case of neurexin 1β, ‘L’. EGF-like domains (abbreviated from Epidermal Growth Factor) are shown as black ovals labeled ‘A’, ‘B’ and ‘C’. A short β-neurexin specific sequence is indicated as ‘β-specific’. In addition to the extracellular domain, neurexins also contain a signal peptide, single transmembrane segment and a cytoplasmic tail (not shown). The five positions in the extracellular domain of α-neurexins that accommodate splice insert sites are indicated (SS#1, SS#2, SS#3, SS#4 and SS#5) as well as the two splice insert sites found in β-neurexins (SS#4 and SS#5). In the rat and bovine species n1α_L4 accommodates a glycine or a 10 a.a. insert at SS#3 (DCIRINCNSS) and n1β_L (with identical sequence to n1α_L6) accommodates either no insert or a 30 a.a. sequence at SS#4 (GNNDNERLAIARQRIPYRLGRVVDEWLLDK) (Ushkaryov et al., 1994; Ullrich et al., 1995). b) Structure of n1α_L2 (Sheckler et al., 2006). The splice insert sites SS#2, SS#3 and SS#4 are shown in yellow, green and magenta respectively, forming a region called the “hyper-variable surface” shaded in grey. A Ca2+-ion is observed experimentally in n1α_L2 at the center of the hyper-variable surface, shown as a blue sphere. Loops β2-β3, β6-β7 and β10-β11 identified to be crucial for synaptogenic activity and neuroligin binding are indicated (Graf et al., 2006).
Figure 2
Figure 2
Ribbon diagram of n1β_L(30). The β-sandwich is shown in a face view (left) and side view (right). β-strands are depicted as light blue arrows. Helical residues are shown in pink with the exception of the residues belonging to the thirty amino acid splice insert at SS#4 which are shown in magenta (part of helix Sα1). Residues Pro199 - Ile215 (part of loop β10-β11) are not visible in the structure, and are depicted here as a dotted line. A Ca2+-ion is observed at the hyper-variable surface, shown here as a blue sphere, the N-terminus and C-terminus of the polypeptide chain are indicated with “N-term” and “C-term” respectively. Dimensions for the β-sandwich (cyan) and the protruding helix Sα1 (pink/magenta) are indicated.
Figure 3
Figure 3
Helix Sα1 adopts a well-defined orientation in the crystal structure of n1β_L(30). a) superposition of the crystallographically independent n1β_L(30) molecules A (yellow) and B (magenta) found in the asymmetric unit. b) omit map density for Sα1 in molecule A. c) omit map density for Sα1 in molecule B. The figures b) and c) display electron density contoured at 1σ from simulated annealed composite omit maps calculated by CNS (Brunger et al., 1998). The Ca2+-ion is shown as a blue sphere.
Figure 4
Figure 4
Structural comparison of n1β_L(30) and n1β. a) superposition of n1β_L(30) (grey Cα-trace) and n1β (cyan trace). The Sα1-helix seen only in n1β_L(30) is shown in maroon (the splice insert residues Pro216-Lys230) and in yellow (residues Gly231-Thr235). The residues Gly231-Thr235 in n1β are displayed in orange. b) Close-up of the structural rearrangements that occur to loop β10-β11 upon incorporation of a splice insert at SS#4 in n1β. N1β_L(30) in grey, yellow and maroon, and n1β in cyan. Relevant side chains are depicted in ball-and-stick (carbon, yellow or cyan, nitrogen, blue and oxygen, red respectively). The Ca2+-ion is shown as a blue sphere. A cyan arrow indicates where the splice insert site SS#4 maps in n1β.
Figure 5
Figure 5
Ca2+-binding sites in neurexin LNS/LG domains. a) Ca2+-binding site observed in n1β_L(30), b) Ca2+-binding site observed in n1β, and c) schematic comparison of experimentally determined Ca2+-binding sites in neurexin LNS/LG domains n1α_L2, n1α_L4, n1β_L/n1α_L6 and n1β_L(30)/n1α_L6(30), with information for n1α_L2 obtained from Sheckler et al., 2006. Relevant side chains are depicted in ball-and-stick (carbon, yellow or grey, nitrogen, blue and oxygen, red respectively). The Ca2+-ion is shown as a blue sphere.
Figure 6
Figure 6
Isothermal titration calorimetric studies of n1β+SS#4 and n1β. Titrations were carried out using a Microcal VP-ITC as described in the Experimental Procedures. Each spike (with the exception of the first) represents the heat evolved in μcal/sec as a result of a 5 μl injection of CaCl2. a) 0.35 mM n1β+SS#4 in CHELEX-treated buffer (10 mM HEPES pH 8, 100 mM NaCl) titrated with 8.1 mM CaCl2 at 5°C. b) 0.35 mM n1β in CHELEX-treated buffer (10 mM HEPES pH 8, 100 mM NaCl) titrated with 8.1 mM CaCl2 at 5°C. For each run the heat of dilution of Ca2+ into buffer obtained by carrying out an identical titration into buffer with no macromolecule is also shown (top trace in each figure, vertically offset by an arbitrary amount for visualization purposes). In both cases, the heat evolved per injection was small and binding did not reach saturation precluding the fitting of a binding isotherm and derivation of a binding constant; titrations using higher protein concentrations were not possible due to limited protein solubility.
Figure 7
Figure 7
Splice insert SS#4 disrupts the protein:protein interface seen in the n1β:neuroligin 1 complex. a) superposition of n1β_L(30) (grey Cα-trace) onto n1β (light cyan Cα-trace) of the n1β:neuroligin 1 complex (PDB Id: 3BIW), with neuroligin 1 shown as a cyan Cα-trace. The splice insert residues are in maroon, “switch” residues in yellow (n1β_L(30)) or orange (n1β) respectively. b) Close-up of the Ca2+-binding site in n1β_L(30) as docked on n1β of the n1β:neuroligin 1 complex. N1β_L(30) shown in grey and yellow, neuroligin 1 in cyan. Relevant side chains are depicted in ball-and-stick (carbon, grey, yellow or cyan; nitrogen, blue; oxygen, red). The Ca2+-ion is shown as a blue sphere. For the sake of clarity the side chain lle236 of n1β_L(30) and the trace of n1β are not shown. Orange arrows indicate the side chain of Glu397 and main chain carbonyl of Gln395 from neuroligin 1 that undergo (water-mediated) interaction with the Ca2+-binding site of n1β (Araç et al., 2007; Chen et al., 2007).

References

    1. Araç D, Boucard AA, Őzkan E, Strop P, Newell E, Südhof TC, Brunger AT. Structures of neuroligin-1 and the neuroligin-1/neurexin-1β complex reveal specific protein:protein and protein-Ca2+ interactions. Neuron. 2007;56:1–12. - PubMed
    1. Boucard AA, Chubykin AA, Comoletti D, Taylor P, Südhof TC. A splice code for trans-synaptic cell adhesion mediated by binding of neuroligin 1 to alpha- and beta-neurexins. Neuron. 2005;48:229–236. - PubMed
    1. Brunger AT, A P, Clore GM, DeLano WL, Gros P, Grosse-Kunstleve RW, Jiang JS, Kuszewski J, Nilges M, Pannu NS, Read RJ, Rice LM, Simonson T, Warren GL. Crystallography & NMR system: a new software suite for macromolecular structure determination. Acta Crystallogr. 1998;D54:905–921. - PubMed
    1. Chen X, Liu H, Shim AHR, Focia PJ, He X. Structural basis for synaptic adhesion mediated by neuroligin-neurexin interactions. Nat Struct Mol Biol. 2007;15:50–56. - PMC - PubMed
    1. Chih B, Engelman H, Scheiffele P. Control of excitatory and inhibitory synapse formation by neuroligins. Science. 2005;307:1324–1328. - PubMed

Publication types

LinkOut - more resources