. 2008 Apr;36(7):e41.
doi: 10.1093/nar/gkn110. Epub 2008 Mar 11.

wuHMM: a robust algorithm to detect DNA copy number variation using long oligonucleotide microarray data

Affiliations

wuHMM: a robust algorithm to detect DNA copy number variation using long oligonucleotide microarray data

Patrick Cahan et al. Nucleic Acids Res. 2008 Apr.

Abstract

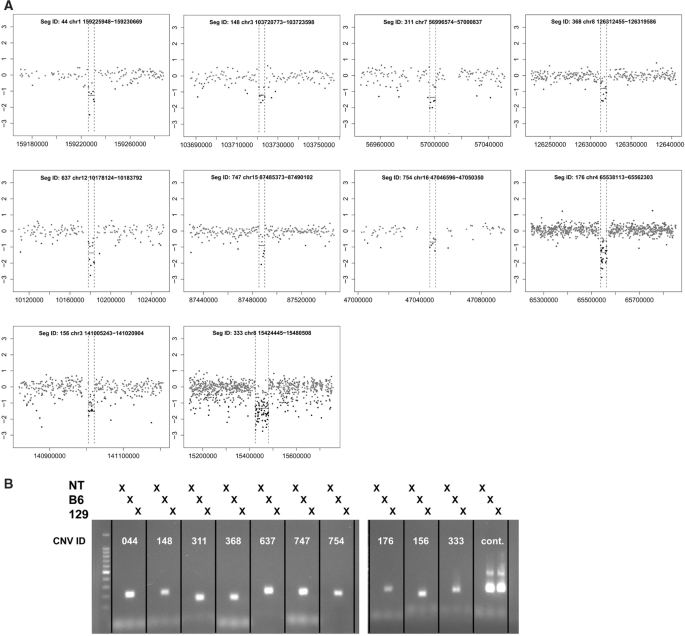
Copy number variants (CNVs) are currently defined as genomic sequences that are polymorphic in copy number and range in length from 1000 to several million base pairs. Among current array-based CNV detection platforms, long-oligonucleotide arrays promise the highest resolution. However, the performance of currently available analytical tools suffers when applied to these data because of the lower signal:noise ratio inherent in oligonucleotide-based hybridization assays. We have developed wuHMM, an algorithm for mapping CNVs from array comparative genomic hybridization (aCGH) platforms comprised of 385 000 to more than 3 million probes. wuHMM is unique in that it can utilize sequence divergence information to reduce the false positive rate (FPR). We apply wuHMM to 385K-aCGH, 2.1M-aCGH and 3.1M-aCGH experiments comparing the 129X1/SvJ and C57BL/6J inbred mouse genomes. We assess wuHMM's performance on the 385K platform by comparison to the higher resolution platforms and we independently validate 10 CNVs. The method requires no training data and is robust with respect to changes in algorithm parameters. At a FPR of <10%, the algorithm can detect CNVs with five probes on the 385K platform and three on the 2.1M and 3.1M platforms, resulting in effective resolutions of 24 kb, 2-5 kb and 1 kb, respectively.


Figures

Figure 1.
Figure 1.
(A) Flow diagram of the wuHMM algorithm. Dashed processes are optional and are executed when the sequence divergence information is utilized. Processes in gray were repeated on permuted probe locations to generate null score distributions for each chromosome. (B) Hidden Markov Model. ‘Norm’, ‘Gain’ and ‘Loss’ indicate states representing normal, increased, and reduced DNA copy number, respectively. Not shown, but implemented, are multiple states per abnormal state that enforce a minimum number of probes per abnormal state. This minimum is automatically selected for each seeded region as described in the Methods section. Transitions are permitted between normal, increased and reduced states. A ‘Join’ state can transition to itself or back to the corresponding abnormal state.
Figure 2.
Figure 2.
3.1M-aCGH log2-ratio plot of 129X1/SvJ chromosome 7. Blocks of sequence divergence are shown in red. Blocks of divergence correspond to aCGH probes with lower log2-ratios and can potentially confound CNV calling algorithms.
Figure 3.
Figure 3.
Receiver operating curves characterize the performance of wuHMM. (A) Each curve represents the performance of wuHMM at a given minimum seed length. Score cutoffs ranging from 0 to 2.5 were used to calculate sensitivities and false positive rates averaged across executions of wuHMM with different numbers of clusters. Circles represent score cutoffs of 0.0, 0.5, 1.0, 1.5 and 2.0, from right to left. The vertical dashed line represents a FPR = 10%. (B) The performance of wuHMM varying the number of clusters in the clustering stage. Score cutoffs ranging from 0 to 2.5 were used to calculate sensitivities and false positive rates averaged across executions of wuHMM with different seed lengths. As in (A), circles represent score cutoffs of 0.0, 0.5, 1.0, 1.5 and 2.0, from right to left, and the vertical dashed line represents a FPR = 10%.
Figure 4.
Figure 4.
Performance differences between wuHMM with sequence divergence and without sequence divergence. (A) FPR difference. Y-axis is the difference between the average false positive rates at the given score cutoff. A value below the y = 0 line represents an improvement in the FPR when sequence divergence is utilized. (B) Sensitivity difference. Y-axis is the difference between the average sensitivities at the given score cutoff. In (A) and (B) each curve represents the performance difference with varying noise penalties (W). FPRs and sensitivities are averaged across a range of values for the number of clusters and minimum seed length.
Figure 5.
Figure 5.
Validation of selected 3.1M-aCGH CNV calls in 129X1/SvJ. (A) Log2-ratio plots of validated 3.1M-aCGH CNV calls. The genomic position is plotted on the x-axis and the log2 (129X1/SvJ signal/C57BL/6J signal) is plotted on the y-axis. CNVs are annotated with a unique identifier (SegID) and boundaries. Dotted lines indicate CNV boundaries as determined by wuHMM. (B) PCR validation. All 10 deletions were validated by PCR, as demonstrated by a visible product using C57BL/6J, but not 129X1/SvJ genomic DNA. The marker is a 100 bp ladder. A region not deleted in 129X1/SvJ serves as a positive control. NT, no template.

References

    1. Iafrate AJ, Feuk L, Rivera MN, Listewnik ML, Donahoe PK, Qi Y, Scherer SW, Lee C. Detection of large-scale variation in the human genome. Nat. Genet. 2004;36:949–951. - PubMed
    1. Sebat J, Lakshmi B, Troge J, Alexander J, Young J, Lundin P, Maner S, Massa H, Walker M, Chi M, et al. Large-scale copy number polymorphism in the human genome. Science. 2004;305:525–528. - PubMed
    1. Redon R, Ishikawa S, Fitch KR, Feuk L, Perry GH, Andrews TD, Fiegler H, Shapero MH, Carson AR, Chen W, et al. Global variation in copy number in the human genome. Nature. 2006;444:444–454. - PMC - PubMed
    1. Wong KK, deLeeuw RJ, Dosanjh NS, Kimm LR, Cheng Z, Horsman DE, MacAulay C, Ng RT, Brown CJ, Eichler EE, et al. A comprehensive analysis of common copy-number variations in the human genome. Am. J. Hum. Genet. 2007;80:91–104. - PMC - PubMed
    1. Perry GH, Tchinda J, McGrath SD, Zhang J, Picker SR, Caceres AM, Iafrate AJ, Tyler-Smith C, Scherer SW, Eichler EE, et al. Hotspots for copy number variation in chimpanzees and humans. Proc. Natl Acad. Sci. USA. 2006;103:8006–8011. - PMC - PubMed

Publication types